When it comes to investing, timing is everything—but not in the way most people think. It’s not about catching the stock price at its exact bottom. It’s about recognizing the trough of the earnings cycle and positioning yourself before the recovery takes hold. Case in point: what happened around the end of 2009.
At that time, the market sported a seemingly wild 33 price-to-earnings (PE) ratio. Earnings had just dropped 50%, and yet some were still willing to pay a 30+ PE. At first glance, that looks insane—but it wasn’t. Earnings were poised to rise 115% in the coming year. For the savvy investor, the takeaway is simple: learn to anticipate earnings recoveries, not just follow lagging indicators like stock prices.
Misreading the PE Can Cost You
Here’s a hard truth: waiting to buy until everything looks cheap on paper can cost you real money. In this specific historical instance, if you’d waited a year and a half to buy, when the PE was seemingly “lower,” you actually would have paid twice as much. That’s the sort of mistake we want to avoid.
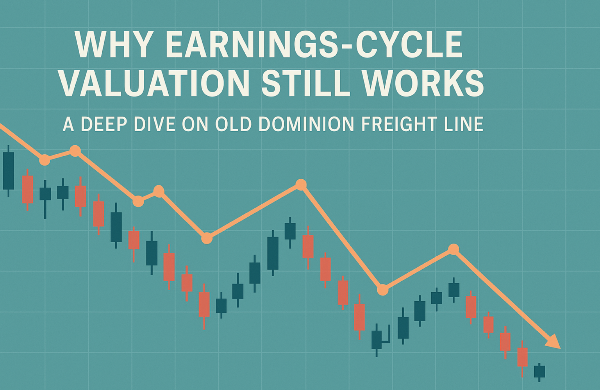
The other common mistake? Following the price down and getting caught in a value trap. But that’s a bit less likely right now—Old Dominion Freight Line (ODFL) is already down about 30%, trending in what might be, from a valuation standpoint, the right direction.
Quality Matters—Even in a Decline
ODFL has quality. Let’s not forget the massive earnings surge it experienced during the pandemic, thanks to COVID stimulus, supply chain disruption, and excess freight demand. It’s no surprise that those conditions are unwinding. Despite falling earnings over the past three years, this doesn’t yet look like a full-blown recession scenario—more like a correction.
If the economy stabilizes over the next year, we could hit what I’d call a full earnings normalization. And from there, the stock’s trajectory will likely follow the macroeconomic outlook.
Modeling a Recession-Era Buy Price
Here’s where things get interesting. I’m using a recession-anchored model for my buy price on ODFL. Think 2008–2009. That cycle is a fair baseline even if the upcoming recession turns out mild.
I use peak earnings—not current or forward projections—as my anchor, which helps avoid being misled by falling earnings and inflated PEs. Right now, I’m working with a peak EPS of $6.09. Based on the methodology I use (a blend of normalized growth and valuation anchored in past recession behavior), the recession-modeled buy price comes out to around $79.
In contrast, if I rely on current earnings—let’s say $5.10 for 2025, which was downgraded from $5.30 recently—the “normal” buy price keeps falling. This illustrates how volatile current earnings-based valuations can be. The recession-adjusted price holds steady, giving us a more resilient reference point during turbulent times.
Understanding “Recession PE”
The way I calculate it is by taking the current stock price and dividing it by the historical peak earnings—not the current or forward EPS. Back in 2009, the PE was around 33 using depressed earnings. But if you based the valuation on the prior peak, you’d get a much more reasonable PE of 12. That’s more in line with recession levels and a healthier starting point for recovery-driven investment.
Applying the same methodology now, ODFL’s current earnings have only declined about 20%. But if that decline deepens to 50%—very plausible in a protracted recession—the stock could fall another 30%, hitting a total drawdown of 50%.
At that level, pessimism reigns. Most recent buyers would be underwater, sentiment will be in the gutter—and that’s precisely the moment to strike.
Historical Validation: The 2022 Seeking Alpha Call
Back in July 2022, I wrote an article on Seeking Alpha titled “Old Dominion Is Extremely Overvalued.” Since then, the stock has dropped about 15%, while the S&P 500 rose 35%. So that bearish call played out well.
The premise was simple: earnings growth was below 5% compounded over 10 years, and the valuation was out of line. No fancy macro predictions—just basic valuation sanity. Now, finally, the earnings deterioration is catching up, and it’s pressing down on the stock price.
Where We Go From Here
There’s still chaos in the goods economy. Tariffs, negotiations, general instability—none of it bodes well for freight. So could the stock fall another 50%? It’s possible. But if it does, the headlines will look scary. That’s when you need to have your plan ready.
I don’t always stick to the same stock. I monitor the market and move when risk/reward ratios start tilting in my favor. But if ODFL hits that recession buy zone, I’d give it a hard second look—context included.
Final Takeaway: Patience Is a Position
Let’s not forget—if you’d bought during the 2020 dip and sold around when I published my overvaluation warning in mid-2022, you’d be up over 300%. Even now, ODFL is still probably a sell based on valuation, but I’m not banging the table about it.
The key is staying patient. Even cash earned you 5% over the past two years just by waiting. That dry powder is valuable when real opportunities surface.
So yeah—this could be a viable dip… or it could get even better. Either way, stay disciplined. Let the cycle do the heavy lifting, and don’t chase the crowd into the storm.
https://youtu.be/oco0vychFt8?si=qM2t4fLizXNevRDB






