Markets saw a mixed session yesterday—tech closed slightly higher, while utilities and energy sectors pulled back. That dip in utilities? Chalk it up to U.S. treasury yields, which are now sitting just above 5%. Utilities often serve as bond proxies, and when treasury yields climb, investors look to rebalance. Something to keep on your radar as rising rates could cast a longer shadow.
But today’s real spotlight shines on Bill Ackman’s major portfolio move—placing a high-conviction bet on Amazon, a stock that has already delivered 846% returns over the past decade. We're breaking down the decision, what it means, and what else has shifted inside Ackman’s $12 billion portfolio.
Why Amazon, Why Now?
Ackman's entry into Amazon came during a market disruption. The company had just taken a hit tied to tariffs and international trade tensions. He had previously considered the stock too pricey—until that "liberation day" drop made things more appealing.
He’s backing Amazon’s CEO to deliver margin expansion alongside high revenue growth. This isn’t just a speculative buy—it’s a clear vote of confidence in Amazon’s fundamentals and future runway.
Read More: 5 Stocks That Could Outperform Amazon!
| Stock |
Company Name |
Why It May Be Better Than AMZN |
| MSFT |
Microsoft Corp. |
Dominates enterprise software and cloud (Azure); stronger margins and recurring revenue model. |
| SHOP |
Shopify Inc. |
Empowers millions of merchants globally; leverages the rise of decentralized e-commerce. |
| MELI |
MercadoLibre Inc. |
The “Amazon of Latin America” with fintech (MercadoPago) and logistics advantages. |
| GOOG |
Alphabet Inc. |
Massive ad revenue, YouTube dominance, and AI leadership through Google Cloud and DeepMind. |
| NVDA |
NVIDIA Corp. |
Powers AI, gaming, and data centers; exponential growth from generative AI demand. |
Each of these companies offers a compelling growth narrative, whether it’s through AI, cloud, fintech, or global e-commerce. Want to turn this into a carousel or infographic for StockBossUp?
A Portfolio Shuffle: Exit CP, Enter AMZN
One thing that’s flown under the radar is what Ackman gave up to take this position. He’s now fully sold out of Canadian Pacific—regretfully, he says. There’s no indication that he’s bearish on CP, but freeing up capital meant making tough calls. That exit alone represented roughly 9% of his previous portfolio.
He’s also been quietly trimming other holdings like Chipotle Mexican Grill, Hilton, and Universal Music Group. And while Nike was fully sold from the equity side, it was replaced with call options—a strategic shift rather than a departure.
What We Know So Far
Though this move won’t show up until Q2 filings, it’s not the only shake-up. Ackman’s Q1 portfolio showed Uber as his top holding at that time. With Amazon now in play and several trimmings made, there’s a real chance it lands in his top three—if not outright number one.
Looking at Amazon’s super investor popularity, it’s already held by around 24 notable portfolios. That number includes both buys and sells in Q1 2025. For instance, one fund added 75% to its Amazon stake, while others like Hillman Value Fund and Daniel Loeb made trims or exited. Interesting data points, even if not definitive.
Institutions Are Doubling Down Too
Institutional ownership in Amazon sits at a massive 72%. Over the past year, they sold $66 billion worth—but bought nearly $150 billion. In Q1 alone, they net-added $12 billion. That type of aggressive accumulation shows confidence not just in Amazon’s present—but its trajectory.
And it’s not just ownership. Over the last 10 years, Amazon has outperformed the S&P 500 dramatically. The stock is up 11% over the past year and trades around the midpoint of its 52-week range. Wall Street’s got it pegged as a “double strong buy,” with Seeking Alpha echoing the sentiment.
Even with all that love, Amazon is still down 7.5% on the year—something to watch if this Ackman news causes a sentiment shift at the opening bell. Could it spark the kind of momentum shift you see when Buffett buys? Possibly. Though let’s be honest—Buffett’s name carries a special kind of weight.
Performance and Valuation
Amazon pulled in $156 billion last quarter, up 9% year-over-year. AWS continues to lead with a 17% gain, while advertising—its fastest-growing segment—hit $14 billion, up 18%. Looking ahead, analysts expect growth in three of the next four quarters. The company has beaten forecasts four quarters in a row—and by notable margins.
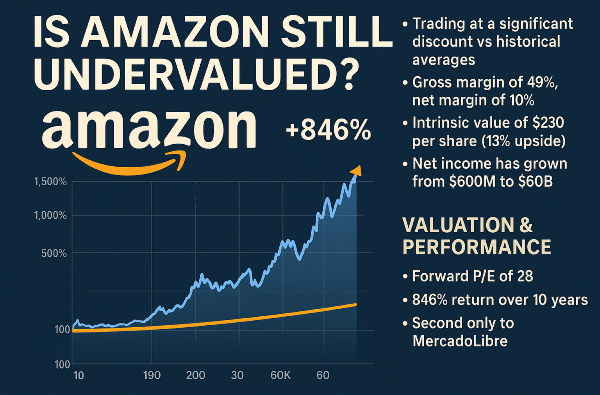
Trading at a forward P/E of 32.88 for 2025 and 28 for 2026, Amazon may not be a bargain-bin stock, but it’s showing consistent growth across revenue, operating income (up 51%), and net income (up 75%).
While AWS is seeing a bit of a deceleration, Amazon retains a 29% market share in a cloud space growing at 23% annually. Even if growth cools slightly, it still stands as the market leader with strong profitability.
Here’s the second half of the SEO-friendly article based entirely on your transcript. The tone, structure, and light-bold formatting remain true to the source material:
Valuation in Focus: Discounted, Yet Still Dominant
Amazon is currently trading at an 82% discount to its own 5-year average when measured by traditional valuation metrics. That contrast is even more striking when placed against broader sector comparisons, where it trades at a noticeable premium.
Even though several analysts have revised their price targets, their sentiment remains clear: Amazon is still seen as a buy. JMP and Jefferies both maintain a $240 target, signaling continued confidence—even amid those adjusted outlooks.
Financials That Stretch Across Time
Looking at Amazon’s underlying performance, the numbers remain remarkably strong. Free cash flow is projected to rise in the next 12 months, hovering near the $4 mark. While growth in sales has decelerated slightly, Amazon has still achieved double-digit revenue growth in nine of the past ten years, including a projected 24% uptick for 2024. That’s nearly 6x revenue growth over the last decade.
But not everything is ideal. The growing number of shares outstanding reflects investor dilution—a sticking point. Buybacks could return value directly to shareholders, as we’ve seen with other tech players. Still, if Amazon continues to consistently outperform the S&P 500, it may be a trade-off investors are willing to accept.
Return on invested capital (ROIC) exceeded 10% in 2024, showing management’s effectiveness in capital allocation—though the trend hasn’t always been as strong historically. With $100 billion in capex planned for 2025, efficiency in spending will be critical.
Margins tell a similar story. Operating margin has moved from 2% ten years ago to 11% today. Free cash flow margin is approaching the desired 5% threshold, and net debt to EBITDA is sitting at a comfortable 0.35—well below the cautionary level of 3. The balance sheet, in short, looks strong.
Sector Premium—Deserved or Debatable?
So why does Amazon earn a premium over its sector peers? The case is built on strong grades: A− for growth, A+ for profitability. Gross margin stands at 49%—a solid step above its 5-year average of 44% and the sector’s 39%. The bottom line? Amazon holds a 10% net margin versus the sector’s 4%.
Cash from operations? A commanding $114 billion, nearly double its own historical average and well beyond the sector’s total.
Investor sentiment remains firmly bullish. Market mood is still in “greed” territory, currently at a reading of 66. And that liberation-day dip? Likely the perfect entry point Bill Ackman used to pounce.
Relative Position: Amazon vs The World
Amazon’s forward P/E of 28 reflects an all-time low over its own 10-year range. Compared to its peers—Alibaba, PDD, MercadoLibre—it’s up 11% on the year. That trails the group, but stretch the timeline and the story shifts.
Over five years, Amazon has gained 67%, still trailing the S&P’s 100% climb. But over the past decade? It’s up 846%, second only to MercadoLibre’s 1,712%.
Net Income and Cash Health
Net income tells the other half of the story. Ten years ago, Amazon was pulling $600 million. Today? Around $60 billion. Meanwhile, total cash reserves have climbed from $20 billion in 2015 to $95 billion today. But total debt has ballooned too—from $17.5 billion to $158 billion—making the net debt-to-EBITDA figure one to monitor as capex ramps up.
Intrinsic Value: What’s It Really Worth?
Using a discounted cash flow (DCF) model with a 20% expected growth rate, Amazon’s intrinsic value sits around $230 per share, offering about 13% upside. Bump that growth to 25% or 30%, and the upside climbs to 60% and 124%, respectively. Still, sticking to a conservative view with a 10–15% margin of safety offers a grounded way to assess current pricing.
Buy, Hold, or Wait?
With average analyst targets still clustered around $240 and bullish ratings across Wall Street and Seeking Alpha, the broader picture remains optimistic. The question is—how do you interpret that 10–15% margin of safety?
Is Amazon worth adding at current levels? Or is it one to hold through volatility? Bill Ackman’s recent move shows high conviction, but the call—as always—is yours.
https://youtu.be/mMO7gvjrEfs?si=n2dKMCkxImOSrhiC


Markets saw a mixed session yesterday—tech closed slightly higher, while utilities and energy sectors pulled back. That dip in utilities? Chalk it up to U.S. treasury yields, which are now sitting just above 5%. Utilities often serve as bond proxies, and when treasury yields climb, investors look to rebalance. Something to keep on your radar as rising rates could cast a longer shadow.
But today’s real spotlight shines on Bill Ackman’s major portfolio move—placing a high-conviction bet on Amazon, a stock that has already delivered 846% returns over the past decade. We're breaking down the decision, what it means, and what else has shifted inside Ackman’s $12 billion portfolio.
Why Amazon, Why Now?
Ackman's entry into Amazon came during a market disruption. The company had just taken a hit tied to tariffs and international trade tensions. He had previously considered the stock too pricey—until that "liberation day" drop made things more appealing.
He’s backing Amazon’s CEO to deliver margin expansion alongside high revenue growth. This isn’t just a speculative buy—it’s a clear vote of confidence in Amazon’s fundamentals and future runway.
Each of these companies offers a compelling growth narrative, whether it’s through AI, cloud, fintech, or global e-commerce. Want to turn this into a carousel or infographic for StockBossUp?
A Portfolio Shuffle: Exit CP, Enter AMZN
One thing that’s flown under the radar is what Ackman gave up to take this position. He’s now fully sold out of Canadian Pacific—regretfully, he says. There’s no indication that he’s bearish on CP, but freeing up capital meant making tough calls. That exit alone represented roughly 9% of his previous portfolio.
He’s also been quietly trimming other holdings like Chipotle Mexican Grill, Hilton, and Universal Music Group. And while Nike was fully sold from the equity side, it was replaced with call options—a strategic shift rather than a departure.
What We Know So Far
Though this move won’t show up until Q2 filings, it’s not the only shake-up. Ackman’s Q1 portfolio showed Uber as his top holding at that time. With Amazon now in play and several trimmings made, there’s a real chance it lands in his top three—if not outright number one.
Looking at Amazon’s super investor popularity, it’s already held by around 24 notable portfolios. That number includes both buys and sells in Q1 2025. For instance, one fund added 75% to its Amazon stake, while others like Hillman Value Fund and Daniel Loeb made trims or exited. Interesting data points, even if not definitive.
Institutions Are Doubling Down Too
Institutional ownership in Amazon sits at a massive 72%. Over the past year, they sold $66 billion worth—but bought nearly $150 billion. In Q1 alone, they net-added $12 billion. That type of aggressive accumulation shows confidence not just in Amazon’s present—but its trajectory.
And it’s not just ownership. Over the last 10 years, Amazon has outperformed the S&P 500 dramatically. The stock is up 11% over the past year and trades around the midpoint of its 52-week range. Wall Street’s got it pegged as a “double strong buy,” with Seeking Alpha echoing the sentiment.
Even with all that love, Amazon is still down 7.5% on the year—something to watch if this Ackman news causes a sentiment shift at the opening bell. Could it spark the kind of momentum shift you see when Buffett buys? Possibly. Though let’s be honest—Buffett’s name carries a special kind of weight.
Performance and Valuation
Amazon pulled in $156 billion last quarter, up 9% year-over-year. AWS continues to lead with a 17% gain, while advertising—its fastest-growing segment—hit $14 billion, up 18%. Looking ahead, analysts expect growth in three of the next four quarters. The company has beaten forecasts four quarters in a row—and by notable margins.
Trading at a forward P/E of 32.88 for 2025 and 28 for 2026, Amazon may not be a bargain-bin stock, but it’s showing consistent growth across revenue, operating income (up 51%), and net income (up 75%).
While AWS is seeing a bit of a deceleration, Amazon retains a 29% market share in a cloud space growing at 23% annually. Even if growth cools slightly, it still stands as the market leader with strong profitability.
Here’s the second half of the SEO-friendly article based entirely on your transcript. The tone, structure, and light-bold formatting remain true to the source material:
Valuation in Focus: Discounted, Yet Still Dominant
Amazon is currently trading at an 82% discount to its own 5-year average when measured by traditional valuation metrics. That contrast is even more striking when placed against broader sector comparisons, where it trades at a noticeable premium.
Even though several analysts have revised their price targets, their sentiment remains clear: Amazon is still seen as a buy. JMP and Jefferies both maintain a $240 target, signaling continued confidence—even amid those adjusted outlooks.
Financials That Stretch Across Time
Looking at Amazon’s underlying performance, the numbers remain remarkably strong. Free cash flow is projected to rise in the next 12 months, hovering near the $4 mark. While growth in sales has decelerated slightly, Amazon has still achieved double-digit revenue growth in nine of the past ten years, including a projected 24% uptick for 2024. That’s nearly 6x revenue growth over the last decade.
But not everything is ideal. The growing number of shares outstanding reflects investor dilution—a sticking point. Buybacks could return value directly to shareholders, as we’ve seen with other tech players. Still, if Amazon continues to consistently outperform the S&P 500, it may be a trade-off investors are willing to accept.
Return on invested capital (ROIC) exceeded 10% in 2024, showing management’s effectiveness in capital allocation—though the trend hasn’t always been as strong historically. With $100 billion in capex planned for 2025, efficiency in spending will be critical.
Margins tell a similar story. Operating margin has moved from 2% ten years ago to 11% today. Free cash flow margin is approaching the desired 5% threshold, and net debt to EBITDA is sitting at a comfortable 0.35—well below the cautionary level of 3. The balance sheet, in short, looks strong.
Sector Premium—Deserved or Debatable?
So why does Amazon earn a premium over its sector peers? The case is built on strong grades: A− for growth, A+ for profitability. Gross margin stands at 49%—a solid step above its 5-year average of 44% and the sector’s 39%. The bottom line? Amazon holds a 10% net margin versus the sector’s 4%.
Cash from operations? A commanding $114 billion, nearly double its own historical average and well beyond the sector’s total.
Investor sentiment remains firmly bullish. Market mood is still in “greed” territory, currently at a reading of 66. And that liberation-day dip? Likely the perfect entry point Bill Ackman used to pounce.
Relative Position: Amazon vs The World
Amazon’s forward P/E of 28 reflects an all-time low over its own 10-year range. Compared to its peers—Alibaba, PDD, MercadoLibre—it’s up 11% on the year. That trails the group, but stretch the timeline and the story shifts.
Over five years, Amazon has gained 67%, still trailing the S&P’s 100% climb. But over the past decade? It’s up 846%, second only to MercadoLibre’s 1,712%.
Net Income and Cash Health
Net income tells the other half of the story. Ten years ago, Amazon was pulling $600 million. Today? Around $60 billion. Meanwhile, total cash reserves have climbed from $20 billion in 2015 to $95 billion today. But total debt has ballooned too—from $17.5 billion to $158 billion—making the net debt-to-EBITDA figure one to monitor as capex ramps up.
Intrinsic Value: What’s It Really Worth?
Using a discounted cash flow (DCF) model with a 20% expected growth rate, Amazon’s intrinsic value sits around $230 per share, offering about 13% upside. Bump that growth to 25% or 30%, and the upside climbs to 60% and 124%, respectively. Still, sticking to a conservative view with a 10–15% margin of safety offers a grounded way to assess current pricing.
Buy, Hold, or Wait?
With average analyst targets still clustered around $240 and bullish ratings across Wall Street and Seeking Alpha, the broader picture remains optimistic. The question is—how do you interpret that 10–15% margin of safety?
Is Amazon worth adding at current levels? Or is it one to hold through volatility? Bill Ackman’s recent move shows high conviction, but the call—as always—is yours.
https://youtu.be/mMO7gvjrEfs?si=n2dKMCkxImOSrhiC