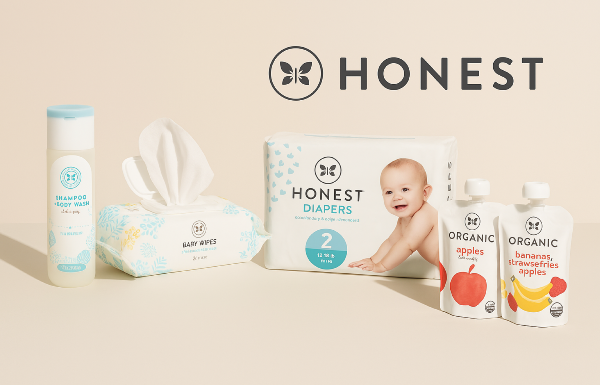
Hey everybody, welcome back to another stock breakdown—today we’re diving into the Honest Company. They focus on non-toxic, natural baby products, mostly sold online. I’ll admit up front, I didn’t know much about them before this video. But now that we’ve gone over their numbers and financial trajectory, there’s definitely some good stuff to talk about. So buckle up—let’s see what they’ve been up to and where they might be headed next.
Overview: Small Cap, Big Ambitions
Starting off with the basics—their market cap is currently around $500 million, which classifies them as a fairly small company. Their target price is sitting at $7.42, and the current stock price is just under $5. So right away, there’s a bit of upside being projected.
If you zoom out on the chart, you’ll notice that the stock has actually been way lower in the past two years. Seeing the company climb back from that kind of low could suggest they’re on a slow but steady turnaround. There’s also a long-term upward trend here—not perfectly defined, but it’s there.
Read More: Similar stocks to HNST
| Symbol |
Company Name |
Why It’s Similar to HNST |
| USNA |
USANA Health Sciences, Inc. 🧪 |
Personal care and wellness focus, strong direct-to-consumer model. |
| NATR |
Nature’s Sunshine Products 🌿 |
Clean-label natural wellness products—aligned values with HNST’s ethos. |
| HLF |
Herbalife Ltd. 💪 |
Global nutrition giant with a wellness and health-driven audience. |
| TDUP |
ThredUp Inc. 👗♻️ |
Eco-conscious resale platform targeting sustainability-focused consumers. |
| RVLV |
Revolve Group, Inc. ✨👠 |
Trendy digital-first brand reaching the same style-savvy demographic. |
Growth Summary: Mixed Signals, But Sales Are There
Let’s talk growth. In all honesty, it’s not amazing. But it’s not terrible either.
Sales are trending positive, which is a great place to start. It’s just that there isn’t enough data yet to really see what the analysts and institutional folks are saying about long-term potential. So yeah—overall, it’s a mixed bag. But again, positive sales is still a win.
Earnings Snapshot: Signs of Life in 2024
So Honest recently reported their fourth quarter and full-year financials, and here’s where things get more interesting.
- Quarterly revenue was $100 million, marking an 11% increase year-over-year.
- Their gross margin expanded by 530 basis points, reaching 39%.
- Most notably, they recorded their first full-year positive adjusted EBITDA as a public company.
That last point is kind of a big deal. They also highlighted a 900 basis point increase in gross margin compared to the previous year. So not just revenue growth, but actual efficiency gains too.
2025 Outlook: Modest but Focused
Looking ahead, Honest is expecting 4–6% annual revenue growth, which is part of their long-term financial algorithm. They’re projecting full-year adjusted EBITDA of $27–30 million, incorporating known tariff impacts from China and Mexico.
So it’s a pretty modest plan, but the consistency is what counts here.
Geographic Revenue Breakdown
Almost all of Honest’s sales are coming from the United States. Makes sense, given the nature of their product line and branding. But it also means there's limited geographic diversification at the moment. Based on their earnings note, it’s likely their sourcing happens mainly in China and Mexico, hence the mention of tariffs.
Income Statement Trends
Looking at the income statement, there’s been clear sales growth over the last couple of years. They’ve had two solid years in a row—2022 and 2023—and even though net income isn’t quite positive yet, operating income is.
They’ve also been steadily increasing their total shares. They went public in 2021, which explains the spike that year. Since then, they’ve issued more shares, but nothing crazy. Might be a small red flag for long-term holders, but it hasn’t been excessive so far.
Balance Sheet Strength: Lean but Stable
Their total assets have actually declined a bit since their 2021 peak, mainly because they had a huge influx of cash back then. But the important thing is they’re making more sales with fewer resources.
Property, plant, and equipment have been shrinking every year—which suggests they’re cutting operational costs. That’s not a bad thing if sales keep going up. And they’ve got $75 million in cash with only $20 million in debt. That’s a very solid position.
Cash Flow: Two Years of Positive Momentum
Operating cash flow has been positive for two straight years, which is encouraging. Most of their investing cash flow is tied to capex, and they’ve also been selling off investments—again, as seen on the balance sheet.
In terms of financing, they’ve been diluting a little bit—but nothing crazy. They did $41 million in stock issuance recently, which is about 4–5% of total valuation. That’s manageable. Their 2021 dilution was much bigger ($100 million), but that was IPO-related and kind of expected.
Free cash flow was also positive in the last two years, which further supports that turnaround narrative.
Margin Progression: Real Improvement
Now for the ratios. This is where you start to see the business fundamentals actually improving:
- Gross margin is at 37%, their best on record.
- Operating margin turned positive and is well above their five-year average.
- Net margin is still slightly negative, but with this trend, it might flip to positive within the year.
Checking the quarterly view: gross margin hits 38%, operating at 1.8%, and net is closing in on breakeven. Nice little upward slope here.
Debt and Equity
Their debt-to-equity ratio is just 12%, which is incredibly low. That reinforces everything we’ve already seen—minimal debt, solid cash reserves, and healthy balance sheet structure.
Final Thoughts: Bottom of the Trend?
Wrapping this up, the Honest Company is trading significantly lower than when they went public in 2021. But most of that dip likely came from broader market timing and sentiment.
What’s more important is the trend since. They’ve now had six consecutive mostly positive earnings reports after a rough start. That’s momentum you can work with.
This might be a solid entry point if you're looking for something in the small-cap, consumer goods space. The recent earnings report showed some encouraging growth—nothing explosive, but consistently heading in the right direction.
Anyway, that’s all for today. If you're digging these breakdowns, make sure to subscribe, and we’ll catch you in the next one!


Hey everybody, welcome back to another stock breakdown—today we’re diving into the Honest Company. They focus on non-toxic, natural baby products, mostly sold online. I’ll admit up front, I didn’t know much about them before this video. But now that we’ve gone over their numbers and financial trajectory, there’s definitely some good stuff to talk about. So buckle up—let’s see what they’ve been up to and where they might be headed next.
Overview: Small Cap, Big Ambitions
Starting off with the basics—their market cap is currently around $500 million, which classifies them as a fairly small company. Their target price is sitting at $7.42, and the current stock price is just under $5. So right away, there’s a bit of upside being projected.
If you zoom out on the chart, you’ll notice that the stock has actually been way lower in the past two years. Seeing the company climb back from that kind of low could suggest they’re on a slow but steady turnaround. There’s also a long-term upward trend here—not perfectly defined, but it’s there.
Growth Summary: Mixed Signals, But Sales Are There
Let’s talk growth. In all honesty, it’s not amazing. But it’s not terrible either.
Sales are trending positive, which is a great place to start. It’s just that there isn’t enough data yet to really see what the analysts and institutional folks are saying about long-term potential. So yeah—overall, it’s a mixed bag. But again, positive sales is still a win.
Earnings Snapshot: Signs of Life in 2024
So Honest recently reported their fourth quarter and full-year financials, and here’s where things get more interesting.
That last point is kind of a big deal. They also highlighted a 900 basis point increase in gross margin compared to the previous year. So not just revenue growth, but actual efficiency gains too.
2025 Outlook: Modest but Focused
Looking ahead, Honest is expecting 4–6% annual revenue growth, which is part of their long-term financial algorithm. They’re projecting full-year adjusted EBITDA of $27–30 million, incorporating known tariff impacts from China and Mexico.
So it’s a pretty modest plan, but the consistency is what counts here.
Geographic Revenue Breakdown
Almost all of Honest’s sales are coming from the United States. Makes sense, given the nature of their product line and branding. But it also means there's limited geographic diversification at the moment. Based on their earnings note, it’s likely their sourcing happens mainly in China and Mexico, hence the mention of tariffs.
Income Statement Trends
Looking at the income statement, there’s been clear sales growth over the last couple of years. They’ve had two solid years in a row—2022 and 2023—and even though net income isn’t quite positive yet, operating income is.
They’ve also been steadily increasing their total shares. They went public in 2021, which explains the spike that year. Since then, they’ve issued more shares, but nothing crazy. Might be a small red flag for long-term holders, but it hasn’t been excessive so far.
Balance Sheet Strength: Lean but Stable
Their total assets have actually declined a bit since their 2021 peak, mainly because they had a huge influx of cash back then. But the important thing is they’re making more sales with fewer resources.
Property, plant, and equipment have been shrinking every year—which suggests they’re cutting operational costs. That’s not a bad thing if sales keep going up. And they’ve got $75 million in cash with only $20 million in debt. That’s a very solid position.
Cash Flow: Two Years of Positive Momentum
Operating cash flow has been positive for two straight years, which is encouraging. Most of their investing cash flow is tied to capex, and they’ve also been selling off investments—again, as seen on the balance sheet.
In terms of financing, they’ve been diluting a little bit—but nothing crazy. They did $41 million in stock issuance recently, which is about 4–5% of total valuation. That’s manageable. Their 2021 dilution was much bigger ($100 million), but that was IPO-related and kind of expected.
Free cash flow was also positive in the last two years, which further supports that turnaround narrative.
Margin Progression: Real Improvement
Now for the ratios. This is where you start to see the business fundamentals actually improving:
Checking the quarterly view: gross margin hits 38%, operating at 1.8%, and net is closing in on breakeven. Nice little upward slope here.
Debt and Equity
Their debt-to-equity ratio is just 12%, which is incredibly low. That reinforces everything we’ve already seen—minimal debt, solid cash reserves, and healthy balance sheet structure.
Final Thoughts: Bottom of the Trend?
Wrapping this up, the Honest Company is trading significantly lower than when they went public in 2021. But most of that dip likely came from broader market timing and sentiment.
What’s more important is the trend since. They’ve now had six consecutive mostly positive earnings reports after a rough start. That’s momentum you can work with.
This might be a solid entry point if you're looking for something in the small-cap, consumer goods space. The recent earnings report showed some encouraging growth—nothing explosive, but consistently heading in the right direction.
Anyway, that’s all for today. If you're digging these breakdowns, make sure to subscribe, and we’ll catch you in the next one!