Explore the typical price range of large-cap stocks, what drives their valuations, and how to evaluate them across sectors.
| Company Name |
Symbol |
Dividend Yield |
P/E Ratio |
Market Cap (Approx.) |
Sector |
| Apple |
AAPL |
0.50% |
29.4 |
$2.9T |
Information Technology |
| Microsoft |
MSFT |
0.75% |
35.2 |
$3.1T |
Information Technology |
| Nvidia |
NVDA |
0.03% |
70.1 |
$2.8T |
Information Technology |
| Johnson & Johnson |
JNJ |
3.30% |
15.8 |
$370B |
Healthcare |
| UnitedHealth Group |
UNH |
1.50% |
20.6 |
$470B |
Healthcare |
| JPMorgan Chase |
JPM |
2.30% |
11.9 |
$570B |
Financials |
| Bank of America |
BAC |
2.70% |
11.2 |
$300B |
Financials |
| Amazon |
AMZN |
N/A |
42.5 |
$1.9T |
Consumer Discretionary |
| Tesla |
TSLA |
N/A |
75.3 |
$580B |
Consumer Discretionary |
| Alphabet |
GOOGL |
N/A |
27.8 |
$2.2T |
Communication Services |
| Meta Platforms |
META |
0.45% |
28.6 |
$1.3T |
Communication Services |
| Boeing |
BA |
N/A |
N/A |
$110B |
Industrials |
| Union Pacific |
UNP |
2.20% |
21.4 |
$140B |
Industrials |
| Procter & Gamble |
PG |
2.50% |
25.1 |
$390B |
Consumer Staples |
| Coca-Cola |
KO |
3.10% |
22.7 |
$260B |
Consumer Staples |
| ExxonMobil |
XOM |
3.90% |
10.4 |
$470B |
Energy |
| Chevron |
CVX |
4.10% |
11.3 |
$290B |
Energy |
| NextEra Energy |
NEE |
2.70% |
18.9 |
$140B |
Utilities |
| Duke Energy |
DUK |
4.20% |
16.5 |
$80B |
Utilities |
| Dow Inc. |
DOW |
5.10% |
14.2 |
$40B |
Materials |
| Newmont Corporation |
NEM |
3.80% |
22.1 |
$35B |
Materials |
| American Tower |
AMT |
3.30% |
45.6 |
$90B |
Real Estate |
| Prologis |
PLD |
2.90% |
38.4 |
$110B |
Real Estate |
| Verizon Communications |
VZ |
6.10% |
8.7 |
$186B |
Communication Services |
| Booking Holdings |
BKNG |
N/A |
27.3 |
$120B |
Consumer Discretionary |
How Market Capitalization Influences Stock Prices and Investment Strategy
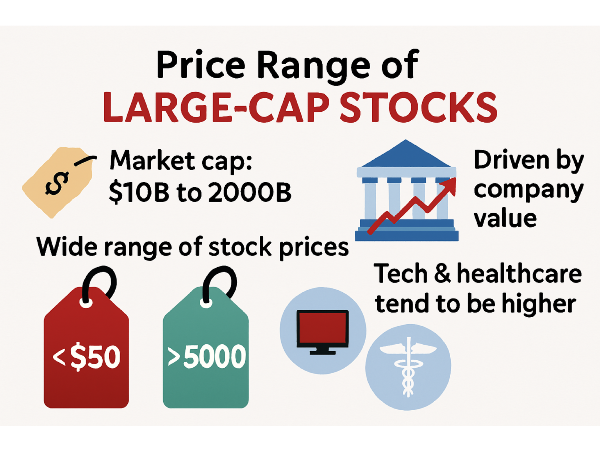
Large-cap stocks—typically defined as companies with a market capitalization between $10 billion and $200 billion—are the backbone of the equity market. These firms are often industry leaders with global reach, stable earnings, and strong investor confidence. Market capitalization, calculated by multiplying a company’s stock price by its total number of outstanding shares, reflects the overall value of a company in the public market. However, a high stock price doesn’t always mean a company is large-cap, nor does a low price imply a small-cap status.
In this article, we’ll explore the typical price range of large-cap stocks, what drives their valuations, and how these prices vary across sectors. We’ll also examine the key factors influencing stock price movements and offer practical strategies for evaluating large-cap investments in today’s dynamic market.
Want expert insights from leading investment podcasts? Scroll to the end to the Podcast Transcripts📜
What Makes a Stock Large-Cap? Understanding Market Cap and Price Dynamics
Large-cap stocks are defined by their market capitalization, typically ranging from $10 billion to $200 billion. Market cap is calculated by multiplying a company’s stock price by its total number of outstanding shares. For example, Verizon Communications VZ trades under $50 but has a market cap exceeding $180 billion. On the other hand, Booking Holdings BKNG trades above $5,000 per share with a similar market cap, illustrating that price alone doesn’t define a company’s size.
Mega-cap stocks, such as Apple AAPL and Microsoft MSFT, exceed $200 billion in market cap and often dominate index performance. These companies are typically included in major benchmarks like the S&P 500 and Nasdaq-100.
In The Investor’s Podcast Network, analysts noted, “Market cap is the true measure of a company’s market weight—not its share price” (🎧 08:20), emphasizing the importance of understanding valuation beyond surface-level figures. Meanwhile, Morningstar’s Investing Insights highlighted, “Investors often confuse high price with high value, but they’re not the same” (🎧 09:45), reinforcing the need to look deeper into fundamentals.
Sources:
Stock Analysis – List of Large-Cap Stocks
Investopedia – Market Capitalization Explained
MarketBeat – What Are Large-Cap Stocks?
The Investor’s Podcast Network
Morningstar’s Investing Insights
StockBossUp – What is the Price Range for Large-Cap Stocks?
Yahoo Finance – Sector Performance
ETF.com – Sector Exposure in Large-Cap ETFs
SoFi – S&P 500 Sector Weights
World P/E Ratio – Sector P/E and Valuation
FTSE Russell – Russell 1000 Index Methodology
CGAA – Publicly Traded Companies by Sector
Typical Price Range of Large-Cap Stocks: Why Price Doesn’t Equal Value
Large-cap stocks span a wide spectrum of share prices, ranging from under $50 to well over $5,000. For instance, Verizon Communications VZ trades below $50 per share, while Booking Holdings BKNG trades above $5,000. Despite this vast difference in price, both companies qualify as large-cap because their total market capitalization exceeds $10 billion. The number of shares outstanding plays a crucial role in shaping a stock’s price.
According to Investopedia, “a company valued at $10 million could have a million shares worth $10, or a hundred thousand shares priced at $100—but the value of the company is still the same.” This means that investors should focus on valuation metrics like earnings, revenue, and growth potential rather than price alone.
In The Investor’s Podcast Network, analysts emphasized, “A high stock price doesn’t mean a stock is expensive—it just reflects how the company structures its equity” (🎧 07:55). Meanwhile, Morningstar’s Investing Insights noted, “Investors often misjudge value by focusing on price instead of fundamentals” (🎧 09:20). These insights reinforce the importance of looking beyond the sticker price when evaluating large-cap stocks.
Sources:
Investopedia – Understanding Stock Prices and Value
The Motley Fool – How Many Shares Should I Buy of a Stock?
Nasdaq – Why Trade Sizes and Stock Prices Matter
The Investor’s Podcast Network
Morningstar’s Investing Insights
StockBossUp – What is the Price Range for Large-Cap Stocks?
Yahoo Finance – Sector Performance
ETF.com – Sector Exposure in Large-Cap ETFs
SoFi – S&P 500 Sector Weights
World P/E Ratio – Sector P/E and Valuation
FTSE Russell – Russell 1000 Index Methodology
CGAA – Publicly Traded Companies by Sector
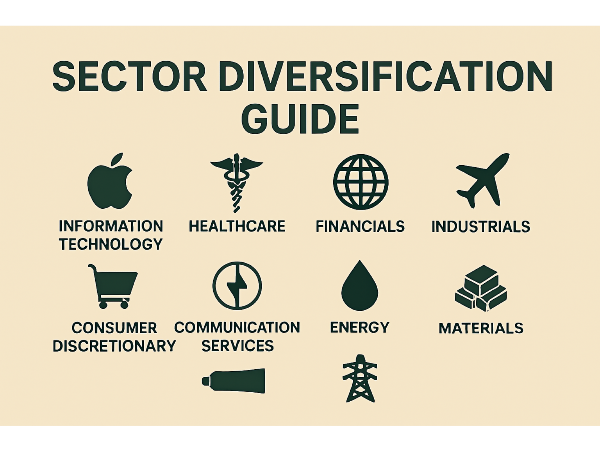
Sector-Based Price Differences: Why Tech Stocks Cost More Than Utilities
Technology stocks, for example, often command higher share prices and valuation multiples because of their rapid innovation cycles and scalable business models. Companies like Microsoft MSFT frequently trade above $400 per share, reflecting strong revenue growth, high margins, and investor confidence in long-term digital transformation trends.
In contrast, utility companies such as NextEra Energy NEE tend to have lower share prices, often under $100. Healthcare stocks also exhibit elevated valuations, particularly for firms with strong pipelines or dominant market positions. Merck & Co. MRK, for instance, trades in the $120–$140 range, supported by consistent earnings and demand for pharmaceutical innovation. According to Siblis Research, the Information Technology sector currently trades at a P/E ratio above 41, while Utilities hover around 19.
In Morningstar’s Investing Insights, analysts noted, “Valuation premiums in tech and healthcare are justified by their innovation pipelines and pricing power” (🎧 11:30). Meanwhile, The Investor’s Podcast Network emphasized, “Sector pricing reflects not just earnings, but the narrative investors believe in” (🎧 10:05). These insights highlight how sector-based price differences are shaped by both fundamentals and forward-looking sentiment.
Sources:
Siblis Research – Sector P/E and Earnings
Applied Finance – Valuations in the Energy & Utility Sectors
The Investor’s Podcast Network
Morningstar’s Investing Insights
StockBossUp – Sector Representation in Large-Cap Stocks
Yahoo Finance – Sector Performance
ETF.com – Sector Exposure in Large-Cap ETFs
SoFi – S&P 500 Sector Weights
World P/E Ratio – Sector P/E and Valuation
FTSE Russell – Russell 1000 Index Methodology
CGAA – Publicly Traded Companies by Sector
Key Drivers of Large-Cap Stock Prices: From Earnings to Economic Shocks
Core financial metrics such as earnings per share (EPS), revenue growth, and the price-to-earnings (P/E) ratio are central to valuation. Companies with consistent earnings growth and strong margins—like Microsoft MSFT or Merck MRK—often command premium valuations. Stocks can surge or slump based on expectations, even before earnings are released.
In The Investor’s Podcast Network, analysts noted, “Stock prices often move on emotion before fundamentals catch up” (🎧 10:40), highlighting how momentum and narrative can drive short-term price swings. Meanwhile, Morningstar’s Investing Insights emphasized, “Investor psychology can amplify volatility, especially in large-cap tech” (🎧 12:15), pointing to the outsized influence of sentiment in sectors like technology.
Macroeconomic factors—such as interest rate changes, inflation trends, and geopolitical events—can cause broad market shifts that affect large-cap valuations. Additionally, company-specific news like earnings surprises, leadership transitions, or mergers and acquisitions (M&A) can trigger sharp price movements.
Sources:
Motilal Oswal – Key Factors That Drive Higher P/E Ratios
FasterCapital – EPS and P/E Ratio: Unveiling the Earnings Power
DCF Modeling – Factors Affecting Price/Earnings Ratio
The Investor’s Podcast Network
Morningstar’s Investing Insights
StockBossUp – What is the Price Range for Large-Cap Stocks?
Yahoo Finance – Sector Performance
ETF.com – Sector Exposure in Large-Cap ETFs
SoFi – S&P 500 Sector Weights
World P/E Ratio – Sector P/E and Valuation
FTSE Russell – Russell 1000 Index Methodology
CGAA – Publicly Traded Companies by Sector
Historical Trends and Volatility in Large-Cap Stocks: Lessons from Market Shocks
Large-cap stock prices have experienced notable shifts over the past two decades, shaped by economic cycles, policy changes, and global events. During the 2008 financial crisis, large-cap indices like the S&P 500 saw steep declines, followed by a decade-long bull market driven by low interest rates and tech innovation. The COVID-19 pandemic triggered one of the sharpest market drops in history, with the VIX volatility index spiking above 80 in March 2020—levels not seen since the Great Recession. Yet, large-cap stocks rebounded quickly, led by companies like Apple AAPL and Microsoft MSFT, as investors flocked to quality and resilience.
In Morningstar’s Investing Insights, analysts noted, “Large-cap stocks tend to recover faster due to stronger balance sheets and broader market confidence” (🎧 13:05). Meanwhile, The Investor’s Podcast Network highlighted, “Volatility is lower in large-caps, but when macro shocks hit, even the biggest names can swing hard” (🎧 11:40). These insights reflect how large-cap stocks, while generally less volatile than small-caps, are not immune to systemic risks.
Sources:
Statista – Market Volatility Since Coronavirus News
CME Group – Was 2024 a Year of Volatility?
Academia – Comparing Trends in Large Cap, Mid Cap and Small Cap Indices During and After COVID-19
The Investor’s Podcast Network
Morningstar’s Investing Insights
StockBossUp – What is the Price Range for Large-Cap Stocks?
Yahoo Finance – Sector Performance
ETF.com – Sector Exposure in Large-Cap ETFs
SoFi – S&P 500 Sector Weights
World P/E Ratio – Sector P/E and Valuation
FTSE Russell – Russell 1000 Index Methodology
CGAA – Publicly Traded Companies by Sector
How to Evaluate Large-Cap Stocks by Price and Valuation Metrics
A stock trading at $50 may be overvalued, while one priced at $500 could be a bargain—depending on earnings, growth, and sector benchmarks. Key metrics like the price-to-earnings (P/E) ratio, dividend yield, and earnings growth rate help investors assess whether a stock’s price aligns with its underlying value.
In Morningstar’s Investing Insights, analysts noted, “Valuation is about context—price only matters when you know what you’re getting for it” (🎧 08:50). Meanwhile, The Investor’s Podcast Network emphasized, “Comparing price to sector benchmarks helps investors avoid overpaying for hype” (🎧 10:25).
Sources:
Investopedia – How to Value a Stock
Kiplinger – Valuation Metrics That Will Make You a Better Investor
Morningstar – Market Fair Value
The Investor’s Podcast Network
Morningstar’s Investing Insights
StockBossUp – What is the Price Range for Large-Cap Stocks?
Yahoo Finance – Sector Performance
ETF.com – Sector Exposure in Large-Cap ETFs
SoFi – S&P 500 Sector Weights
World P/E Ratio – Sector P/E and Valuation
FTSE Russell – Russell 1000 Index Methodology
CGAA – Publicly Traded Companies by Sector
Conclusion
Understanding the price range of large-cap stocks requires more than a glance at share prices—it demands a deeper look into market capitalization, sector dynamics, and valuation metrics. From tech giants trading above $500 to utility leaders priced under $100, large-cap stocks span a wide spectrum shaped by earnings power, investor sentiment, and macroeconomic forces. While price alone doesn’t define value, tools like StockBossUp, Morningstar, and Yahoo Finance help investors assess whether a stock is fairly valued within its sector.
By analyzing historical trends, sector-based pricing, and key valuation drivers, investors can make more informed decisions and build resilient portfolios that align with both market conditions and long-term goals. This comprehensive view empowers smarter investing in today’s dynamic large-cap landscape.
Podcast Transcripts 🎧
Motley Fool Money – Dividend Stocks for a Volatile Market
“Dividends are the ballast in your portfolio” (🎧 12:45)
This episode explores how dividend-paying companies offer stability in turbulent markets. The hosts highlight sectors like consumer staples and utilities, and discuss how dividend consistency can anchor long-term portfolios.
We Study Billionaires – How Billionaires Use Dividends
“Steady growth from broad market exposure anchors long-term wealth” (🎧 10:15)
“Dividend reinvestment compounds returns over decades” (🎧 16:20)
This episode examines how legendary investors like Warren Buffett and Charlie Munger use dividend-paying stocks to build wealth, emphasizing the power of compounding and long-term holding.
Morningstar’s Investing Insights – Dividend Investing in 2025
“Low fees and market efficiency are key to building wealth” (🎧 12:30) “Diversification supports sustainable income” (🎧 14:20)
Analysts discuss undervalued sectors like healthcare and energy, and how dividend growth stocks are positioned for the year ahead.
Dividend Talk – From Dividend Cuts to Recovery
“When a dividend seems too high, it’s a cue to investigate further” (🎧 11:36)
“Dividend cuts can lead to long-term resilience” (🎧 27:50)
This episode explores companies that have cut dividends—like Shell and General Electric—and how some rebounded while others struggled.
The Long View – How to Build a Dividend Portfolio
“A diversified dividend portfolio shields against market shocks” (🎧 13:55)
“Align dividend strategies with long-term wealth goals” (🎧 21:18)
This episode offers a deep dive into constructing a dividend-focused portfolio, balancing yield with growth, and avoiding overconcentration.
The Meb Faber Show – Avoiding Dividend Traps
“A blind allegiance to dividends could be a very, very bad idea” (🎧 09:10)
“Stripping out top dividend payers can improve after-tax returns” (🎧 12:40)
Meb Faber discusses the risks of high-yield dividend stocks in taxable accounts and advocates for a total return approach.
📌Read More About:
Top Large Cap Stocks- https://stockbossup.com/pages/topics/large-cap
What Are Large US Cap Stocks?- https://stockbossup.com/pages/post/39045/understanding-large-us-cap-stocks-and-their-market-influence
How Many Large Cap Stocks Are There?- https://stockbossup.com/pages/post/39123/how-many-large-cap-stocks-exist-market-trends-and-investment-insights
Why Are Large Caps Outperforming?- https://stockbossup.com/pages/post/39128/why-large-cap-stocks-are-outperforming-market-trends-and-investment-insights
Which Large Cap Fund is Best Now?- https://stockbossup.com/pages/post/39144/best-large-cap-funds-for-maximum-returns-in-2025
Top Sectors in Large Cap Stocks: A Complete Breakdown for Smart Investors- https://stockbossup.com/pages/post/39244/top-sectors-in-large-cap-stocks-a-complete-breakdown-for-smart-investors


Explore the typical price range of large-cap stocks, what drives their valuations, and how to evaluate them across sectors.
How Market Capitalization Influences Stock Prices and Investment Strategy
Large-cap stocks—typically defined as companies with a market capitalization between $10 billion and $200 billion—are the backbone of the equity market. These firms are often industry leaders with global reach, stable earnings, and strong investor confidence. Market capitalization, calculated by multiplying a company’s stock price by its total number of outstanding shares, reflects the overall value of a company in the public market. However, a high stock price doesn’t always mean a company is large-cap, nor does a low price imply a small-cap status.
In this article, we’ll explore the typical price range of large-cap stocks, what drives their valuations, and how these prices vary across sectors. We’ll also examine the key factors influencing stock price movements and offer practical strategies for evaluating large-cap investments in today’s dynamic market.
What Makes a Stock Large-Cap? Understanding Market Cap and Price Dynamics
Large-cap stocks are defined by their market capitalization, typically ranging from $10 billion to $200 billion. Market cap is calculated by multiplying a company’s stock price by its total number of outstanding shares. For example, Verizon Communications VZ trades under $50 but has a market cap exceeding $180 billion. On the other hand, Booking Holdings BKNG trades above $5,000 per share with a similar market cap, illustrating that price alone doesn’t define a company’s size.
Mega-cap stocks, such as Apple AAPL and Microsoft MSFT, exceed $200 billion in market cap and often dominate index performance. These companies are typically included in major benchmarks like the S&P 500 and Nasdaq-100.
In The Investor’s Podcast Network, analysts noted, “Market cap is the true measure of a company’s market weight—not its share price” (🎧 08:20), emphasizing the importance of understanding valuation beyond surface-level figures. Meanwhile, Morningstar’s Investing Insights highlighted, “Investors often confuse high price with high value, but they’re not the same” (🎧 09:45), reinforcing the need to look deeper into fundamentals.
Sources:
Stock Analysis – List of Large-Cap Stocks
Investopedia – Market Capitalization Explained
MarketBeat – What Are Large-Cap Stocks?
The Investor’s Podcast Network
Morningstar’s Investing Insights
StockBossUp – What is the Price Range for Large-Cap Stocks?
Yahoo Finance – Sector Performance
ETF.com – Sector Exposure in Large-Cap ETFs SoFi – S&P 500 Sector Weights
World P/E Ratio – Sector P/E and Valuation
FTSE Russell – Russell 1000 Index Methodology
CGAA – Publicly Traded Companies by Sector
Typical Price Range of Large-Cap Stocks: Why Price Doesn’t Equal Value
Large-cap stocks span a wide spectrum of share prices, ranging from under $50 to well over $5,000. For instance, Verizon Communications VZ trades below $50 per share, while Booking Holdings BKNG trades above $5,000. Despite this vast difference in price, both companies qualify as large-cap because their total market capitalization exceeds $10 billion. The number of shares outstanding plays a crucial role in shaping a stock’s price.
According to Investopedia, “a company valued at $10 million could have a million shares worth $10, or a hundred thousand shares priced at $100—but the value of the company is still the same.” This means that investors should focus on valuation metrics like earnings, revenue, and growth potential rather than price alone.
In The Investor’s Podcast Network, analysts emphasized, “A high stock price doesn’t mean a stock is expensive—it just reflects how the company structures its equity” (🎧 07:55). Meanwhile, Morningstar’s Investing Insights noted, “Investors often misjudge value by focusing on price instead of fundamentals” (🎧 09:20). These insights reinforce the importance of looking beyond the sticker price when evaluating large-cap stocks.
Sources:
Investopedia – Understanding Stock Prices and Value The Motley Fool – How Many Shares Should I Buy of a Stock?
Nasdaq – Why Trade Sizes and Stock Prices Matter
The Investor’s Podcast Network
Morningstar’s Investing Insights
StockBossUp – What is the Price Range for Large-Cap Stocks?
Yahoo Finance – Sector Performance
ETF.com – Sector Exposure in Large-Cap ETFs SoFi – S&P 500 Sector Weights
World P/E Ratio – Sector P/E and Valuation
FTSE Russell – Russell 1000 Index Methodology
CGAA – Publicly Traded Companies by Sector
Sector-Based Price Differences: Why Tech Stocks Cost More Than Utilities
Technology stocks, for example, often command higher share prices and valuation multiples because of their rapid innovation cycles and scalable business models. Companies like Microsoft MSFT frequently trade above $400 per share, reflecting strong revenue growth, high margins, and investor confidence in long-term digital transformation trends.
In contrast, utility companies such as NextEra Energy NEE tend to have lower share prices, often under $100. Healthcare stocks also exhibit elevated valuations, particularly for firms with strong pipelines or dominant market positions. Merck & Co. MRK, for instance, trades in the $120–$140 range, supported by consistent earnings and demand for pharmaceutical innovation. According to Siblis Research, the Information Technology sector currently trades at a P/E ratio above 41, while Utilities hover around 19.
In Morningstar’s Investing Insights, analysts noted, “Valuation premiums in tech and healthcare are justified by their innovation pipelines and pricing power” (🎧 11:30). Meanwhile, The Investor’s Podcast Network emphasized, “Sector pricing reflects not just earnings, but the narrative investors believe in” (🎧 10:05). These insights highlight how sector-based price differences are shaped by both fundamentals and forward-looking sentiment.
Sources:
Siblis Research – Sector P/E and Earnings
Applied Finance – Valuations in the Energy & Utility Sectors
The Investor’s Podcast Network
Morningstar’s Investing Insights
StockBossUp – Sector Representation in Large-Cap Stocks
Yahoo Finance – Sector Performance
ETF.com – Sector Exposure in Large-Cap ETFs SoFi – S&P 500 Sector Weights
World P/E Ratio – Sector P/E and Valuation
FTSE Russell – Russell 1000 Index Methodology
CGAA – Publicly Traded Companies by Sector
Key Drivers of Large-Cap Stock Prices: From Earnings to Economic Shocks
Core financial metrics such as earnings per share (EPS), revenue growth, and the price-to-earnings (P/E) ratio are central to valuation. Companies with consistent earnings growth and strong margins—like Microsoft MSFT or Merck MRK—often command premium valuations. Stocks can surge or slump based on expectations, even before earnings are released.
In The Investor’s Podcast Network, analysts noted, “Stock prices often move on emotion before fundamentals catch up” (🎧 10:40), highlighting how momentum and narrative can drive short-term price swings. Meanwhile, Morningstar’s Investing Insights emphasized, “Investor psychology can amplify volatility, especially in large-cap tech” (🎧 12:15), pointing to the outsized influence of sentiment in sectors like technology.
Macroeconomic factors—such as interest rate changes, inflation trends, and geopolitical events—can cause broad market shifts that affect large-cap valuations. Additionally, company-specific news like earnings surprises, leadership transitions, or mergers and acquisitions (M&A) can trigger sharp price movements.
Sources:
Motilal Oswal – Key Factors That Drive Higher P/E Ratios
FasterCapital – EPS and P/E Ratio: Unveiling the Earnings Power
DCF Modeling – Factors Affecting Price/Earnings Ratio
The Investor’s Podcast Network
Morningstar’s Investing Insights
StockBossUp – What is the Price Range for Large-Cap Stocks?
Yahoo Finance – Sector Performance
ETF.com – Sector Exposure in Large-Cap ETFs SoFi – S&P 500 Sector Weights
World P/E Ratio – Sector P/E and Valuation
FTSE Russell – Russell 1000 Index Methodology
CGAA – Publicly Traded Companies by Sector
Historical Trends and Volatility in Large-Cap Stocks: Lessons from Market Shocks
Large-cap stock prices have experienced notable shifts over the past two decades, shaped by economic cycles, policy changes, and global events. During the 2008 financial crisis, large-cap indices like the S&P 500 saw steep declines, followed by a decade-long bull market driven by low interest rates and tech innovation. The COVID-19 pandemic triggered one of the sharpest market drops in history, with the VIX volatility index spiking above 80 in March 2020—levels not seen since the Great Recession. Yet, large-cap stocks rebounded quickly, led by companies like Apple AAPL and Microsoft MSFT, as investors flocked to quality and resilience.
In Morningstar’s Investing Insights, analysts noted, “Large-cap stocks tend to recover faster due to stronger balance sheets and broader market confidence” (🎧 13:05). Meanwhile, The Investor’s Podcast Network highlighted, “Volatility is lower in large-caps, but when macro shocks hit, even the biggest names can swing hard” (🎧 11:40). These insights reflect how large-cap stocks, while generally less volatile than small-caps, are not immune to systemic risks.
Sources:
Statista – Market Volatility Since Coronavirus News
CME Group – Was 2024 a Year of Volatility?
Academia – Comparing Trends in Large Cap, Mid Cap and Small Cap Indices During and After COVID-19
The Investor’s Podcast Network
Morningstar’s Investing Insights
StockBossUp – What is the Price Range for Large-Cap Stocks?
Yahoo Finance – Sector Performance
ETF.com – Sector Exposure in Large-Cap ETFs SoFi – S&P 500 Sector Weights
World P/E Ratio – Sector P/E and Valuation
FTSE Russell – Russell 1000 Index Methodology
CGAA – Publicly Traded Companies by Sector
How to Evaluate Large-Cap Stocks by Price and Valuation Metrics
A stock trading at $50 may be overvalued, while one priced at $500 could be a bargain—depending on earnings, growth, and sector benchmarks. Key metrics like the price-to-earnings (P/E) ratio, dividend yield, and earnings growth rate help investors assess whether a stock’s price aligns with its underlying value.
In Morningstar’s Investing Insights, analysts noted, “Valuation is about context—price only matters when you know what you’re getting for it” (🎧 08:50). Meanwhile, The Investor’s Podcast Network emphasized, “Comparing price to sector benchmarks helps investors avoid overpaying for hype” (🎧 10:25).
Sources:
Investopedia – How to Value a Stock
Kiplinger – Valuation Metrics That Will Make You a Better Investor
Morningstar – Market Fair Value
The Investor’s Podcast Network
Morningstar’s Investing Insights
StockBossUp – What is the Price Range for Large-Cap Stocks?
Yahoo Finance – Sector Performance
ETF.com – Sector Exposure in Large-Cap ETFs SoFi – S&P 500 Sector Weights
World P/E Ratio – Sector P/E and Valuation
FTSE Russell – Russell 1000 Index Methodology
CGAA – Publicly Traded Companies by Sector
Conclusion
Understanding the price range of large-cap stocks requires more than a glance at share prices—it demands a deeper look into market capitalization, sector dynamics, and valuation metrics. From tech giants trading above $500 to utility leaders priced under $100, large-cap stocks span a wide spectrum shaped by earnings power, investor sentiment, and macroeconomic forces. While price alone doesn’t define value, tools like StockBossUp, Morningstar, and Yahoo Finance help investors assess whether a stock is fairly valued within its sector.
By analyzing historical trends, sector-based pricing, and key valuation drivers, investors can make more informed decisions and build resilient portfolios that align with both market conditions and long-term goals. This comprehensive view empowers smarter investing in today’s dynamic large-cap landscape.
Podcast Transcripts 🎧
Motley Fool Money – Dividend Stocks for a Volatile Market
“Dividends are the ballast in your portfolio” (🎧 12:45)
This episode explores how dividend-paying companies offer stability in turbulent markets. The hosts highlight sectors like consumer staples and utilities, and discuss how dividend consistency can anchor long-term portfolios.
We Study Billionaires – How Billionaires Use Dividends
“Steady growth from broad market exposure anchors long-term wealth” (🎧 10:15)
“Dividend reinvestment compounds returns over decades” (🎧 16:20)
This episode examines how legendary investors like Warren Buffett and Charlie Munger use dividend-paying stocks to build wealth, emphasizing the power of compounding and long-term holding.
Morningstar’s Investing Insights – Dividend Investing in 2025
“Low fees and market efficiency are key to building wealth” (🎧 12:30) “Diversification supports sustainable income” (🎧 14:20)
Analysts discuss undervalued sectors like healthcare and energy, and how dividend growth stocks are positioned for the year ahead.
Dividend Talk – From Dividend Cuts to Recovery
“When a dividend seems too high, it’s a cue to investigate further” (🎧 11:36)
“Dividend cuts can lead to long-term resilience” (🎧 27:50)
This episode explores companies that have cut dividends—like Shell and General Electric—and how some rebounded while others struggled.
The Long View – How to Build a Dividend Portfolio
“A diversified dividend portfolio shields against market shocks” (🎧 13:55)
“Align dividend strategies with long-term wealth goals” (🎧 21:18)
This episode offers a deep dive into constructing a dividend-focused portfolio, balancing yield with growth, and avoiding overconcentration.
The Meb Faber Show – Avoiding Dividend Traps
“A blind allegiance to dividends could be a very, very bad idea” (🎧 09:10)
“Stripping out top dividend payers can improve after-tax returns” (🎧 12:40)
Meb Faber discusses the risks of high-yield dividend stocks in taxable accounts and advocates for a total return approach.
📌Read More About:
Top Large Cap Stocks- https://stockbossup.com/pages/topics/large-cap
What Are Large US Cap Stocks?- https://stockbossup.com/pages/post/39045/understanding-large-us-cap-stocks-and-their-market-influence
How Many Large Cap Stocks Are There?- https://stockbossup.com/pages/post/39123/how-many-large-cap-stocks-exist-market-trends-and-investment-insights
Why Are Large Caps Outperforming?- https://stockbossup.com/pages/post/39128/why-large-cap-stocks-are-outperforming-market-trends-and-investment-insights
Which Large Cap Fund is Best Now?- https://stockbossup.com/pages/post/39144/best-large-cap-funds-for-maximum-returns-in-2025
Top Sectors in Large Cap Stocks: A Complete Breakdown for Smart Investors- https://stockbossup.com/pages/post/39244/top-sectors-in-large-cap-stocks-a-complete-breakdown-for-smart-investors