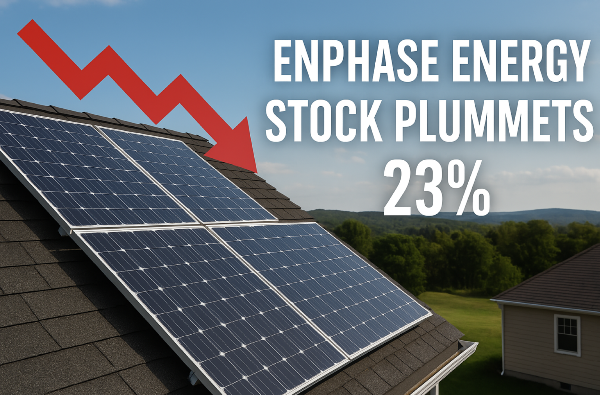
The stock of Enphase Energy (ENPH) shocked investors when it plunged 23% in a single day, extending its slide to down 70% over the past year. The culprit isn’t a failed product or sudden cash burn—it’s political. A new U.S. Senate proposal aims to phase out the solar tax credits that have underpinned residential solar adoption. Without those subsidies, many homeowners may pause or cancel system installations, directly affecting Enphase’s core microinverter and battery business.
Why Solar Tax Credits Matter for Enphase
Solar tax credits reduce the upfront cost of residential systems, making solar panels—and crucially, the microinverters that Enphase supplies—far more affordable.
When credits remain in place, average homeowners see a meaningful reduction in payback period, spurring installations. Remove or scale back incentives, and the value proposition shifts dramatically. Even if equipment costs continue to fall, losing federal support could stall demand, squeezing Enphase’s near-term revenue growth.
This policy uncertainty is the main driver behind ENPH’s sudden drop, rather than any collapse in its technology or balance sheet.
Company Overview: Enphase’s Technology Edge
Behind every rooftop solar array lies a network of power electronics converting DC panel output into AC power usable by home appliances. Enphase makes two key products:
- Microinverters: These are small inverters mounted at each panel, optimizing power harvest from individual modules. They enhance system resilience—if one panel underperforms, the rest continue operating at peak efficiency.
- Energy Storage Batteries: Enphase’s battery systems store excess solar generation, enabling nighttime usage and backup power during outages.
By combining module-level power electronics with intelligent monitoring software, Enphase offers an integrated solution that simplifies installation, enhances safety, and maximizes energy yield.
Financial Performance Snapshot
Enphase’s recent numbers reflect the broader solar cycle and policy headwinds:
- Revenue dropped from $2.7 billion to $1.25 billion, then rebounded to $1.4 billion as demand began to recover.
- Analysts project growing revenue, reaching $1.8 billion within three years.
- Net income fell sharply from $572 million to $148 million, driven by margin compression and lower volumes.
- Free cash flow (FCF) remains strong at $472 million, sustaining an FCF margin between 20% and 33%.
Despite earnings volatility, Enphase has maintained overall profit margins in the 10%–20% range, thanks to efficient production and scalable software services.
Analyst Outlook and Earnings Recovery
Wall Street sees a rebound in Enphase’s fundamental performance:
- EPS is expected to climb back to $3.60 per share in three years as volumes and margins normalize.
- Revenue growth should accelerate once policy headwinds ease and solar installations resume.
- Free cash flow is forecast to stay robust, providing capital for R&D, dividends, or share repurchases.
With ENPH shares trading at a forward P/E of 14 and price/FCF of 12, valuation multiples look attractive compared to historical levels and peer averages.
Deep Dive: Valuation Model
To estimate intrinsic value, I applied a seven-year discounted cash flow model under three scenarios—low, middle, and high. The results:
| Scenario |
Net Income-Based Value |
FCF-Based Value |
Estimated Annual Return |
| Low |
$16 |
$32 |
8.5% |
| Middle |
$47 |
$60 |
19% |
| High |
$79 |
$88 |
29% |
The disparity between net income and free cash flow valuations reflects my assumption of higher FCF conversion versus net margins. Even in the most conservative scenario, investors would earn an 8.5% annualized return, while the optimistic case nears 30%.
Key Assumptions Behind the Model
My projections rest on a set of assumptions that drive the above valuations:
- Revenue Growth: 4% (low), 8% (mid), 12% (high) annually over seven years.
- Profit Margin: 10% (low), 15% (mid), 20% (high) at steady state.
- FCF Margin: 20% (low), 25% (mid), 30% (high) by year seven.
- Exit Multiples: P/E of 15, 17, 19 and corresponding P/FCF multiples at model’s end.
The spreadsheet excludes detailed balance sheet adjustments, but Enphase maintains a conservative capital structure, holding $1.4 billion in cash versus $1.2 billion in debt, supporting financial flexibility.
Business Metrics: Shipments and Geographies
Beyond headline financials, installation and shipment trends reveal underlying demand:
- Microinverter Shipments: These units have declined sharply, mirroring the slowdown in new solar system installations.
- Energy Storage Shipments: Batteries are growing rapidly as homeowners and commercial customers invest in resilience and time-of-use arbitrage.
- Revenue by Region: Both U.S. and international sales dipped, though storage gains have partially offset panel-related weakness, hinting at a cyclical trough in solar demand.
These operational metrics confirm near-term softness but underscore a longer-term shift toward integrated solar-plus-storage solutions.
Risks and Upside Considerations
Investing in Enphase carries several key risks:
- Policy Risk: A full repeal or deep cut to solar tax credits could derail growth projections.
- Competitive Pressure: Other inverter manufacturers or vertically integrated solar players may erode pricing power.
- Supply Chain Disruptions: Component shortages or logistics issues could delay shipments and inflate costs.
On the upside:
- Policy Tailwinds: Any compromise preserving or extending credits would sharply boost installations.
- Technology Leadership: Continued innovation in microinverters and software could expand market share.
- Cash Flow Strength: Robust FCF generation allows Enphase to reinvest in R&D, support dividends, or buy back stock.
Conclusion: A Rare Buying Window?
Enphase Energy’s severe pullback reflects political uncertainty and transient weakness in solar demand—not a broken business model. The company still generates strong free cash flow, maintains a solid balance sheet, and enjoys analyst forecasts for an earnings rebound. My valuation framework suggests ENPH offers attractive returns if growth and margin assumptions hold. Even under conservative scenarios, the downside appears limited for long-term investors who believe in the solar-plus-storage transition.
For those with the conviction to weather policy noise, this sell-off may represent one of the better entry points in years. Share your thoughts on Enphase’s prospects below, and stay tuned for more deep dives into clean energy opportunities.
https://youtu.be/HAQtd07vQ2k?si=O7Jfrz-1MQXgrg3b


The stock of Enphase Energy (ENPH) shocked investors when it plunged 23% in a single day, extending its slide to down 70% over the past year. The culprit isn’t a failed product or sudden cash burn—it’s political. A new U.S. Senate proposal aims to phase out the solar tax credits that have underpinned residential solar adoption. Without those subsidies, many homeowners may pause or cancel system installations, directly affecting Enphase’s core microinverter and battery business.
Why Solar Tax Credits Matter for Enphase
Solar tax credits reduce the upfront cost of residential systems, making solar panels—and crucially, the microinverters that Enphase supplies—far more affordable.
When credits remain in place, average homeowners see a meaningful reduction in payback period, spurring installations. Remove or scale back incentives, and the value proposition shifts dramatically. Even if equipment costs continue to fall, losing federal support could stall demand, squeezing Enphase’s near-term revenue growth.
This policy uncertainty is the main driver behind ENPH’s sudden drop, rather than any collapse in its technology or balance sheet.
Company Overview: Enphase’s Technology Edge
Behind every rooftop solar array lies a network of power electronics converting DC panel output into AC power usable by home appliances. Enphase makes two key products:
By combining module-level power electronics with intelligent monitoring software, Enphase offers an integrated solution that simplifies installation, enhances safety, and maximizes energy yield.
Financial Performance Snapshot
Enphase’s recent numbers reflect the broader solar cycle and policy headwinds:
Despite earnings volatility, Enphase has maintained overall profit margins in the 10%–20% range, thanks to efficient production and scalable software services.
Analyst Outlook and Earnings Recovery
Wall Street sees a rebound in Enphase’s fundamental performance:
With ENPH shares trading at a forward P/E of 14 and price/FCF of 12, valuation multiples look attractive compared to historical levels and peer averages.
Deep Dive: Valuation Model
To estimate intrinsic value, I applied a seven-year discounted cash flow model under three scenarios—low, middle, and high. The results:
The disparity between net income and free cash flow valuations reflects my assumption of higher FCF conversion versus net margins. Even in the most conservative scenario, investors would earn an 8.5% annualized return, while the optimistic case nears 30%.
Key Assumptions Behind the Model
My projections rest on a set of assumptions that drive the above valuations:
The spreadsheet excludes detailed balance sheet adjustments, but Enphase maintains a conservative capital structure, holding $1.4 billion in cash versus $1.2 billion in debt, supporting financial flexibility.
Business Metrics: Shipments and Geographies
Beyond headline financials, installation and shipment trends reveal underlying demand:
These operational metrics confirm near-term softness but underscore a longer-term shift toward integrated solar-plus-storage solutions.
Risks and Upside Considerations
Investing in Enphase carries several key risks:
On the upside:
Conclusion: A Rare Buying Window?
Enphase Energy’s severe pullback reflects political uncertainty and transient weakness in solar demand—not a broken business model. The company still generates strong free cash flow, maintains a solid balance sheet, and enjoys analyst forecasts for an earnings rebound. My valuation framework suggests ENPH offers attractive returns if growth and margin assumptions hold. Even under conservative scenarios, the downside appears limited for long-term investors who believe in the solar-plus-storage transition.
For those with the conviction to weather policy noise, this sell-off may represent one of the better entry points in years. Share your thoughts on Enphase’s prospects below, and stay tuned for more deep dives into clean energy opportunities.
https://youtu.be/HAQtd07vQ2k?si=O7Jfrz-1MQXgrg3b