As one of the UK’s leading banks, HSBC needs little in the way of an introduction.
All I’ll say in these opening remarks is that HSBC is the third largest company in the FTSE 100 and it’s the largest bank in the FTSE 100 by a considerable margin.
It’s also a favourite with income funds and dividend investors and, with its share price at £6.15, it has an attractive dividend yield of 4.2%.
That combination of size and yield puts HSBC in 22nd place on my list of top UK dividend stocks, so I think it's worth looking at this bank in a bit more detail.
Table of contents
HSBC’s share price is low relative to earnings and dividends
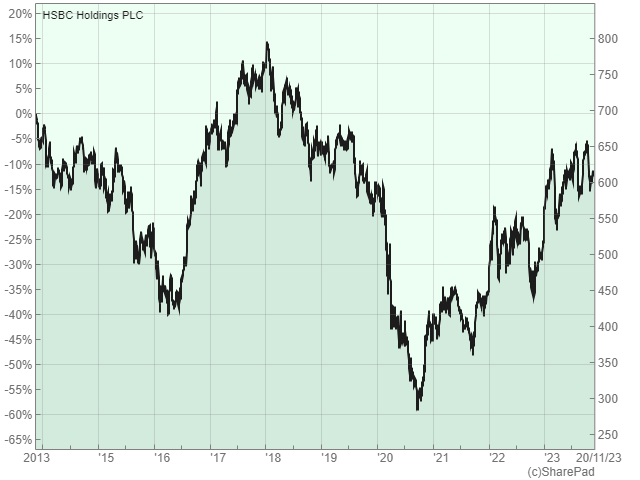
HSBC's share price hasn't exactly set the world on fire these last ten years. In fact, the share price is down slightly since 2013, and that's one reason why the dividend yield is a not insignificant 4.2%.
The FTSE All-Share (at 4,088) has a dividend yield of 3.9%, so HSBC’s yield is slightly above the market average, which is a good place to start.
As well as comparing the share price to last year's dividend, it's also a good idea to compare it to the company's average dividend from the last ten years. The resulting PD10 ratio comes in at 18, which is comfortably below the FTSE All-Share average of 30.
Turning to earnings, HSBC's price-earnings ratio is 10, which is quite low. However, earnings are volatile enough to make the standard PE ratio an unreliable measure of value. That's why I prefer the PE10 ratio, which compares today’s share price to the company’s average earnings over the last ten years.
In this case, HSBC’s PE10 ratio is 14, which is below the FTSE All-Share average of 18.
And so, on this very limited evidence, it seems that HSBC’s share price is low relative to its earnings and dividends.
But is this low price justified because this is a low-quality company, or are we looking at a high-quality company whose shares are being undervalued by an overly pessimistic stock market?
To answer that, let's have a look at HSBC's financial track record, starting with growth.
Consistent dividend growth has been lacking
Quality dividend stocks usually produce relatively consistent growth over long periods of time.
For banks, I want to see reasonably consistent growth across three key numbers on a per-share basis:
- 1). Shareholder equity (as this is the foundation upon which the business stands)
- 2). Assets (as this tells us whether the bank is lending more to its customers)
- 3). Dividends (as dividend investors obviously want to see dividends growing ahead of inflation)
Unfortunately, HSBC has utterly failed to produce consistent inflation-beating growth over the last decade.
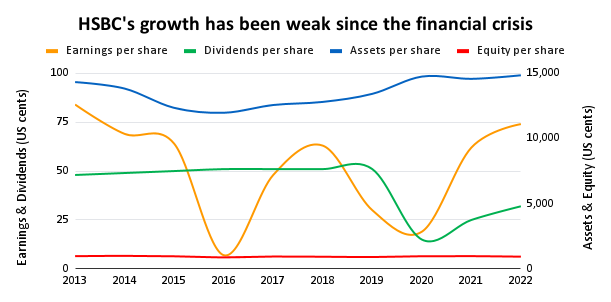
Taking each of those three key numbers in turn:
- Shareholder equity didn’t grow at all over the last ten years
- Assets grew at a very pedestrian and below-inflation rate of 1%, and
- having been cut during the pandemic, the dividend now remains 37% below its pre-pandemic level
Across these three metrics, HSBC has an average ten-year growth rate of minus 3%, which is obviously below inflation. It’s also below my minimum hurdle rate of plus 3%, so I would consider this lack of growth a red flag as it breaks one of my rules:
- Rule of thumb: Only invest if the ten-year growth rate is above 3%
Looking at the company’s recent annual results, the CEO is equally unimpressed. In the 2020 annual report, he announced a significantly refreshed growth strategy:
“The growth plans we are announcing today aim to establish HSBC as a dynamic, efficient and agile global bank with a digital-first mindset, capable of providing a world-leading service to our customers and strong returns for our investors”
The introduction of a new strategy to radically improve HSBC’s performance makes it clear that HSBC is a turnaround stock. Unfortunately, that is another red flag because most quality dividend stocks don’t need turning around because they’re already heading in the right direction.
This isn't a great start, but let's carry on and have a look at HSBC in terms of profitability.
Profitability has been consistently sub-par
For most companies, my go-to profitability metrics are net return on capital and net return on sales (i.e. profit margin).
Banks don’t generate much in the way of “sales”, so like most investors, I look at their net interest margins instead. If you aren't familiar with net interest margin, it tells us how much interest a bank earns on its loans after paying interest on current accounts and other sources of funding.

Let’s start with net return on capital because it’s one of the most informative metrics in investing.
If a company can consistently earn high rates of return on capital, there is a good chance that it has at least one durable competitive advantage. Why? Because if it didn’t, other firms would offer better and/or cheaper products and services and compete away those excess returns.
The minimum acceptable net return on capital for most companies is around 7%. That’s because 7% is the average return investors have historically achieved by putting their money into a simple index tracker.
HSBC has, for most of the last decade, failed to produce even that minimal level of return, with its average net return on capital languishing at just 5%. Even worse, its net return on capital only exceeded 7% in two of the last ten years, so HSBC’s returns have been consistently sub-par.
This is not good. Companies that produce consistently weak returns on capital usually lack durable competitive advantages, which means they are very probably not high-quality businesses.
This is why I use the following rule of thumb:
- Rule of thumb: Only invest if net returns on capital are consistently above 7%
HSBC fails to meet that standard, and that is another red flag.
As for net interest margins, HSBC has produced an average net interest margin of 3% over the last ten years, which is mediocre at best. Even worse, its net interest margin was below 3% for about half of those ten years, and although some of that is due to the excessively low interest rates set by central banks after the financial crisis, that is a weak and feeble excuse.
These low margins mean that HSBC breaks another one of my rules of thumb:
- Rule of thumb: Only invest in a bank if its net interest margins are consistently above 3%
This adds another red flag to HSBC’s growing collection.
I am not alone in thinking that HSBC’s returns are unacceptably low.
In the 2019 annual report, the company’s CEO said, “parts of our business are not delivering acceptable returns. We are therefore outlining a revised plan to increase returns for investors, create the capacity for future investment, and build a platform for sustainable growth”
Once again, HSBC appears to be a supertanker that is attempting to turn itself around after meandering into dangerous waters.
To be honest, at this point, I would usually throw in the towel, because HSBC has failed to grow over the last ten years and, more importantly, it has failed to produce even mediocre levels of profitability.
There is, in short, no chance that HSBC will end up in my UK Dividend Stocks Portfolio anytime soon.
However, in the name of completeness, I want to round out this review by looking at HSBC’s balance sheet, as it could be one reason why the bank’s profitability has been so uninspiring in recent years.
HSBC’s strong balance sheet could be a problem
When we measure the strength of a bank's balance sheet, we're mostly interested in understanding how much of the loan book could default before the bank becomes insolvent. Or, more realistically, before it has to carry out a major rights issue to avoid becoming insolvent.
Balance sheet strength is mainly measured using leverage ratios or capital ratios, and the most important ratio is the common equity tier 1 ratio. This ratio tells us how much “tier 1” capital (which mostly consists of shareholder equity) is available to absorb loan defaults, as a percentage of the bank's risk-weighted loans.
The common equity tier 1 ratio is defined by regulators, so there is a risk that it may change if regulation changes in the future. To avoid that risk, I also use the tangible common equity ratio, which can be calculated directly from the balance sheet as the ratio of tangible equity to total loans and advances.
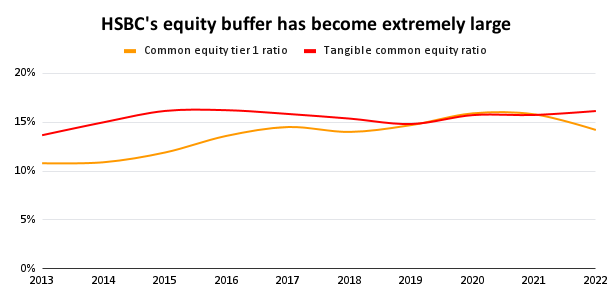
The good news is that HSBC’s capital ratios have been consistently above 10% over the last ten years, which is a night-and-day difference between the level of capital held by most banks before the financial crisis.
Lloyds bank, for example, had a tangible common equity ratio of 3.9% in 2007. That means, very simplistically, that Lloyds could have become insolvent if a mere 4% of its loans went unpaid.
In reality, banks typically carry out major rights issues long before they become insolvent, so the margin of safety for Lloyds was probably much thinner than 4%.
HSBC wasn’t as under-capitalised as Lloyds back then, but it was undercapitalised, with a tangible common equity ratio of just 7.3%.
But that was then and this is now, and HSBC’s equity buffer is now more than twice as strong at around 15% today. That’s a level most bank CEOs would have considered recklessly prudent in 2007, but in 2007, most bank CEOs had no idea how to run a bank.
Thanks to this increasing level of prudence, HSBC easily passes my balance sheet rule of thumb:
- Rule of thumb: Only invest in a bank if its tier 1 and tangible common equity ratios are consistently above 10%
Although it's good that HSBC has a strong balance sheet, there is perhaps a grain of truth in the idea that HSBC’s balance sheet has become too strong.
Of course, I’m an outsider and I have no special insights into the quality of the bank’s loans, but a 15% equity buffer for a mainstream bank does seem to be very conservative.
That level of conservatism limits the amount of lending the bank can do, and that could be one reason why HSBC has failed to generate acceptable returns on capital in recent years.
That's an interesting question, but it isn’t one I intend to answer, because I have no intention of investing in this mediocre bank. Instead, let’s take a step back and look at the big picture.
HSBC has been trying to turn itself around since the financial crisis
The global financial crisis sent cataclysmic shockwaves throughout the global banking industry and those shockwaves are still reverberating today.
Because of that crisis, most of the big banks had to spend years rebuilding the quality of their loan books, rebuilding their balance sheets and rebuilding trust with an understandably sceptical public.
HSBC did come through the crisis in much better shape than many of its peers, but that doesn't make it a high-quality business.
What defines a high-quality business is an ability to consistently earn high rates of return on capital, with those returns being used to fuel an income for shareholders today and growth for the future.
With HSBC, growth has been non-existent, returns on capital have been unacceptably weak and although its balance sheet appears to be extremely robust, there are no obvious signs that HSBC has any durable competitive advantages over its peers.
On that basis, I will be adding HSBC to my blacklist of uninvestable stocks, where it will remain for at least five years.
Perhaps, by then, the CEO will have turned this supertanker around, but I'm not going to hold my breath.
P.S. I realise that I haven't looked at the operational side of HSBC in this review, and you may be wondering why.
The reason is that if a company hasn't produced high returns on capital and consistent growth in the past, then it is unlikely to produce high returns on capital and consistent growth in the future. And if a company is unlikely to produce those results, the operational details of that business are irrelevant, at least from an investment point of view.


As one of the UK’s leading banks, HSBC needs little in the way of an introduction.
All I’ll say in these opening remarks is that HSBC is the third largest company in the FTSE 100 and it’s the largest bank in the FTSE 100 by a considerable margin.
It’s also a favourite with income funds and dividend investors and, with its share price at £6.15, it has an attractive dividend yield of 4.2%.
That combination of size and yield puts HSBC in 22nd place on my list of top UK dividend stocks, so I think it's worth looking at this bank in a bit more detail.
Table of contents
HSBC’s share price is low relative to earnings and dividends
HSBC's share price hasn't exactly set the world on fire these last ten years. In fact, the share price is down slightly since 2013, and that's one reason why the dividend yield is a not insignificant 4.2%.
The FTSE All-Share (at 4,088) has a dividend yield of 3.9%, so HSBC’s yield is slightly above the market average, which is a good place to start.
As well as comparing the share price to last year's dividend, it's also a good idea to compare it to the company's average dividend from the last ten years. The resulting PD10 ratio comes in at 18, which is comfortably below the FTSE All-Share average of 30.
Turning to earnings, HSBC's price-earnings ratio is 10, which is quite low. However, earnings are volatile enough to make the standard PE ratio an unreliable measure of value. That's why I prefer the PE10 ratio, which compares today’s share price to the company’s average earnings over the last ten years.
In this case, HSBC’s PE10 ratio is 14, which is below the FTSE All-Share average of 18.
And so, on this very limited evidence, it seems that HSBC’s share price is low relative to its earnings and dividends.
But is this low price justified because this is a low-quality company, or are we looking at a high-quality company whose shares are being undervalued by an overly pessimistic stock market?
To answer that, let's have a look at HSBC's financial track record, starting with growth.
Consistent dividend growth has been lacking
Quality dividend stocks usually produce relatively consistent growth over long periods of time.
For banks, I want to see reasonably consistent growth across three key numbers on a per-share basis:
Data source: SharePad
Taking each of those three key numbers in turn:
Across these three metrics, HSBC has an average ten-year growth rate of minus 3%, which is obviously below inflation. It’s also below my minimum hurdle rate of plus 3%, so I would consider this lack of growth a red flag as it breaks one of my rules:
Looking at the company’s recent annual results, the CEO is equally unimpressed. In the 2020 annual report, he announced a significantly refreshed growth strategy:
“The growth plans we are announcing today aim to establish HSBC as a dynamic, efficient and agile global bank with a digital-first mindset, capable of providing a world-leading service to our customers and strong returns for our investors”
The introduction of a new strategy to radically improve HSBC’s performance makes it clear that HSBC is a turnaround stock. Unfortunately, that is another red flag because most quality dividend stocks don’t need turning around because they’re already heading in the right direction.
This isn't a great start, but let's carry on and have a look at HSBC in terms of profitability.
Profitability has been consistently sub-par
For most companies, my go-to profitability metrics are net return on capital and net return on sales (i.e. profit margin).
Banks don’t generate much in the way of “sales”, so like most investors, I look at their net interest margins instead. If you aren't familiar with net interest margin, it tells us how much interest a bank earns on its loans after paying interest on current accounts and other sources of funding.
Let’s start with net return on capital because it’s one of the most informative metrics in investing.
If a company can consistently earn high rates of return on capital, there is a good chance that it has at least one durable competitive advantage. Why? Because if it didn’t, other firms would offer better and/or cheaper products and services and compete away those excess returns.
The minimum acceptable net return on capital for most companies is around 7%. That’s because 7% is the average return investors have historically achieved by putting their money into a simple index tracker.
HSBC has, for most of the last decade, failed to produce even that minimal level of return, with its average net return on capital languishing at just 5%. Even worse, its net return on capital only exceeded 7% in two of the last ten years, so HSBC’s returns have been consistently sub-par.
This is not good. Companies that produce consistently weak returns on capital usually lack durable competitive advantages, which means they are very probably not high-quality businesses.
This is why I use the following rule of thumb:
HSBC fails to meet that standard, and that is another red flag.
As for net interest margins, HSBC has produced an average net interest margin of 3% over the last ten years, which is mediocre at best. Even worse, its net interest margin was below 3% for about half of those ten years, and although some of that is due to the excessively low interest rates set by central banks after the financial crisis, that is a weak and feeble excuse.
These low margins mean that HSBC breaks another one of my rules of thumb:
This adds another red flag to HSBC’s growing collection.
I am not alone in thinking that HSBC’s returns are unacceptably low.
In the 2019 annual report, the company’s CEO said, “parts of our business are not delivering acceptable returns. We are therefore outlining a revised plan to increase returns for investors, create the capacity for future investment, and build a platform for sustainable growth”
Once again, HSBC appears to be a supertanker that is attempting to turn itself around after meandering into dangerous waters.
To be honest, at this point, I would usually throw in the towel, because HSBC has failed to grow over the last ten years and, more importantly, it has failed to produce even mediocre levels of profitability.
There is, in short, no chance that HSBC will end up in my UK Dividend Stocks Portfolio anytime soon.
However, in the name of completeness, I want to round out this review by looking at HSBC’s balance sheet, as it could be one reason why the bank’s profitability has been so uninspiring in recent years.
HSBC’s strong balance sheet could be a problem
When we measure the strength of a bank's balance sheet, we're mostly interested in understanding how much of the loan book could default before the bank becomes insolvent. Or, more realistically, before it has to carry out a major rights issue to avoid becoming insolvent.
Balance sheet strength is mainly measured using leverage ratios or capital ratios, and the most important ratio is the common equity tier 1 ratio. This ratio tells us how much “tier 1” capital (which mostly consists of shareholder equity) is available to absorb loan defaults, as a percentage of the bank's risk-weighted loans.
The common equity tier 1 ratio is defined by regulators, so there is a risk that it may change if regulation changes in the future. To avoid that risk, I also use the tangible common equity ratio, which can be calculated directly from the balance sheet as the ratio of tangible equity to total loans and advances.
The good news is that HSBC’s capital ratios have been consistently above 10% over the last ten years, which is a night-and-day difference between the level of capital held by most banks before the financial crisis.
Lloyds bank, for example, had a tangible common equity ratio of 3.9% in 2007. That means, very simplistically, that Lloyds could have become insolvent if a mere 4% of its loans went unpaid.
In reality, banks typically carry out major rights issues long before they become insolvent, so the margin of safety for Lloyds was probably much thinner than 4%.
HSBC wasn’t as under-capitalised as Lloyds back then, but it was undercapitalised, with a tangible common equity ratio of just 7.3%.
But that was then and this is now, and HSBC’s equity buffer is now more than twice as strong at around 15% today. That’s a level most bank CEOs would have considered recklessly prudent in 2007, but in 2007, most bank CEOs had no idea how to run a bank.
Thanks to this increasing level of prudence, HSBC easily passes my balance sheet rule of thumb:
Although it's good that HSBC has a strong balance sheet, there is perhaps a grain of truth in the idea that HSBC’s balance sheet has become too strong.
Of course, I’m an outsider and I have no special insights into the quality of the bank’s loans, but a 15% equity buffer for a mainstream bank does seem to be very conservative.
That level of conservatism limits the amount of lending the bank can do, and that could be one reason why HSBC has failed to generate acceptable returns on capital in recent years.
That's an interesting question, but it isn’t one I intend to answer, because I have no intention of investing in this mediocre bank. Instead, let’s take a step back and look at the big picture.
HSBC has been trying to turn itself around since the financial crisis
The global financial crisis sent cataclysmic shockwaves throughout the global banking industry and those shockwaves are still reverberating today.
Because of that crisis, most of the big banks had to spend years rebuilding the quality of their loan books, rebuilding their balance sheets and rebuilding trust with an understandably sceptical public.
HSBC did come through the crisis in much better shape than many of its peers, but that doesn't make it a high-quality business.
What defines a high-quality business is an ability to consistently earn high rates of return on capital, with those returns being used to fuel an income for shareholders today and growth for the future.
With HSBC, growth has been non-existent, returns on capital have been unacceptably weak and although its balance sheet appears to be extremely robust, there are no obvious signs that HSBC has any durable competitive advantages over its peers.
On that basis, I will be adding HSBC to my blacklist of uninvestable stocks, where it will remain for at least five years.
Perhaps, by then, the CEO will have turned this supertanker around, but I'm not going to hold my breath.
P.S. I realise that I haven't looked at the operational side of HSBC in this review, and you may be wondering why.
The reason is that if a company hasn't produced high returns on capital and consistent growth in the past, then it is unlikely to produce high returns on capital and consistent growth in the future. And if a company is unlikely to produce those results, the operational details of that business are irrelevant, at least from an investment point of view.
Originally Posted on ukdividendstocks.com