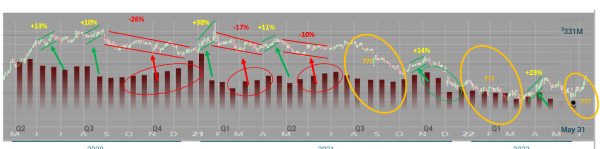
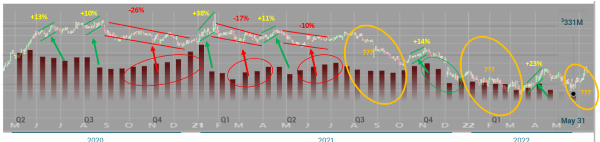
The case for buying the dip is based on the availability of undervalued assets in a market that has suffered indiscriminate selling.
Chart 1. Oversold and ripe for a rebound.
On Thursday, May 12th the S&P 500 hit an intraday low of 3859 before recovering to close at 3930. At the low point, the market was down 19.5% from its January peak and a whisker short of entering bear market territory.
Then on Friday, May 13th the dip buyers showed up again, driving the market up another 2.4% to close the week at 4023. That left the market with a peak-to-trough decline of 16.1%. Investors are now left wondering if the bottom is in.
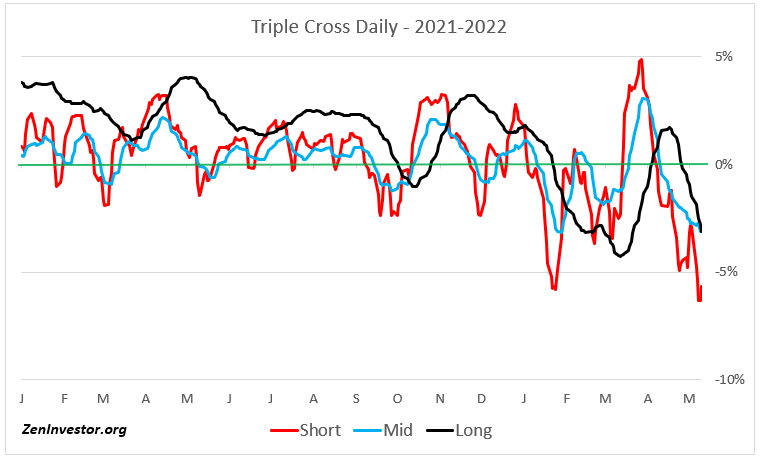
I don't know if the bottom is in, but I do know that there are some outstanding bargains to be had. The market may only be down by 16.1% but the majority of stocks - 65% - are already in a bear market. The median stock in the S&P 1500 Composite index, which covers large, mid and small caps, is down 25.5% from its 52 week high.
Chart 2. Major Markets
Of the seven global equity markets I cover in this chart, Russell 2000 (small caps) and NASDAQ (tech dominated) are currently in bear market territory. Some of the other markets may soon follow, but I think most of the damage has already been done.
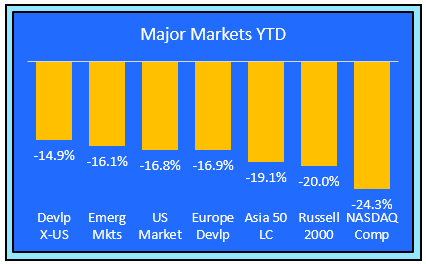
Chart 3. Market Sectors
Of the eleven primary market sectors, this chart shows the top three and bottom three performers. I do it this way to keep things simple.
Money has been flowing out of tech, consumer discretionary, and communications services, and into energy, utilities, and consumer staples. This trend will probably continue as long as there is uncertainty caused by the Russia-Ukraine war. Demand for oil & gas remains high, the global economy is taking a hit to growth. and inflation will continue to rise until energy prices begin to come down.
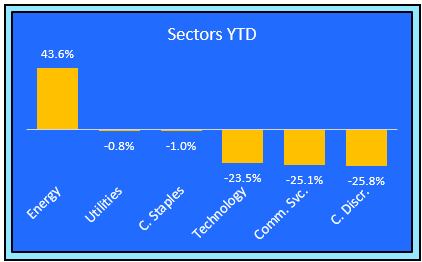
Chart 4. Industries
Of the 60 industry groups tracked by S&P Global Markets, I highlight the top and bottom three to keep this chart simple. Semiconductors, apparel, and autos are in bear markets and ripe with bargains for those who can tolerate a little more pain in the near-term.
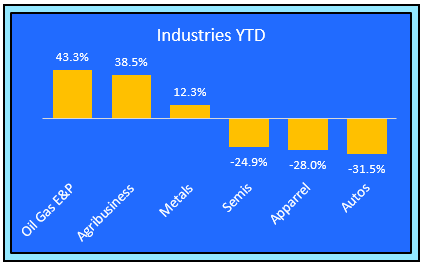
Chart 5. Styles - Growth vs. Value
After underperforming growth last year, value is where the money is flowing. I see this as another durable trend. Growth has been hit hard by the slide in tech stocks this year. Small cap growth is where I would be looking to pick up quality names on the cheap.
Chart 6. Size
Small caps are still lagging. After underperforming last year, they are struggling to keep up this year. Mid caps were almost tied with large caps last year, and the are in the lead this year. The flow of money into mid caps looks like a durable trend.
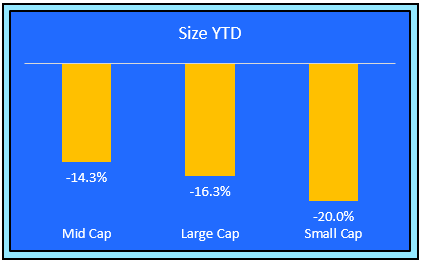
Chart 7. Factors
There are more than 100 factors to choose from, so I had to cut the list to just six, in order to keep this chart reasonably easy to digest. High liquidity names are getting pummeled this year as asset managers sell their most liquid positions to meet shareholder redemptions.
The top performing factor so far is dividend yield. I'm not sure about the durability of this trend, because rising bond interest rates will begin to compete with dividends at some point.
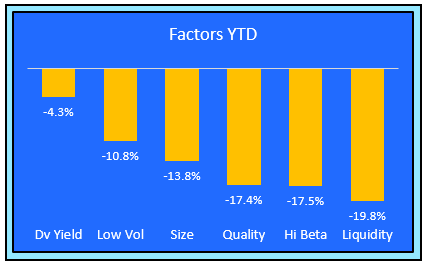
Chart 8. Sensitivity to the business cycle
In this chart I divided the market sectors into two groups - those that respond more vigorously to the changing phases of the business cycle (cyclical), and those that respond less vigorously (defensive).
With the economy still in growth mode, cyclical stocks should do better than defensive stocks. That hasn't happened yet this year, and maybe the market is sending a signal that the economy isn't as strong as many would like to believe.
The flow of money away from cyclicals and into defensive looks durable.
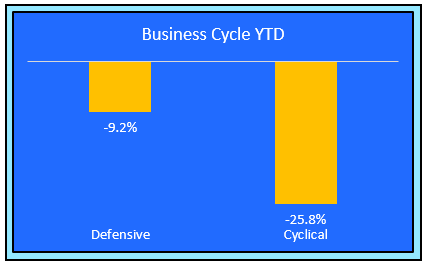
Chart 9. Bonds
It's interesting to watch how the various flavors of bonds react to Quantitative Tightening. So far it looks like Treasury bonds are seeing the most outflows. That's understandable, given the sharp rise in the 2-yr and 10-yr rates.
Keep an eye on junk bonds, because they are especially vulnerable to an economic slowdown. As they continue to lose momentum, the risk of recession increases.
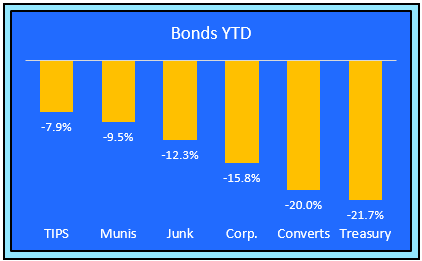
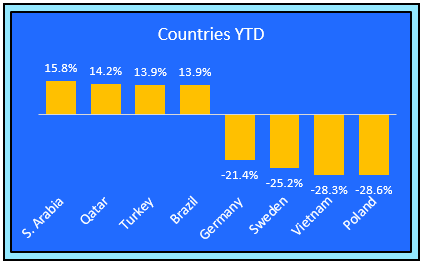
Chart 10. Countries
There are 50 countries that are represented by ETFs. Here are the top and bottom performers YTD. South America is having a resurgence this year, while Europe is struggling with geopolitical issues and heavy sanctions - both imposed and threatened.
Final Thoughts
We are now well into 2022 and the trends we have established thus far will probably continue as long as the war, and all the uncertainty it brings with it, remains in place. By keeping an eye on money flows among these asset categories, you can gain some insight into what could be a durable trend, and what's just noise.
The trends that look the most durable to me at this time are value vs. growth, mid cap vs. large and small cap, defensive vs. cyclical, and commodities - especially energy - vs. tech.
European and Asian economies seem more vulnerable to the fallout from sanctions against Russia. There is a chance that Europe may slip into a recession later this year, and some Asian countries may follow after that.
The US will likely avoid a recession this year, but the picture may change in 2023. The major Wall Street strategists have been reducing their price targets for year-end, with an average of 4600 for the S&P 500. That would represent a gain of 14% from where we are now, and a year-over-year loss of 3%.
As the late Marty Zweig used to say, don't fight the tape and don't fight the Fed. The tape is weak and the Fed appears to be gearing up to bring inflation under control regardless of what happens in the stock market. If the market ends the year with a small loss, it behooves investors to pick their spots carefully. That's why I like to follow the money.


The case for buying the dip is based on the availability of undervalued assets in a market that has suffered indiscriminate selling.
Chart 1. Oversold and ripe for a rebound.
On Thursday, May 12th the S&P 500 hit an intraday low of 3859 before recovering to close at 3930. At the low point, the market was down 19.5% from its January peak and a whisker short of entering bear market territory.
Then on Friday, May 13th the dip buyers showed up again, driving the market up another 2.4% to close the week at 4023. That left the market with a peak-to-trough decline of 16.1%. Investors are now left wondering if the bottom is in.
I don't know if the bottom is in, but I do know that there are some outstanding bargains to be had. The market may only be down by 16.1% but the majority of stocks - 65% - are already in a bear market. The median stock in the S&P 1500 Composite index, which covers large, mid and small caps, is down 25.5% from its 52 week high.
Chart 2. Major Markets
Of the seven global equity markets I cover in this chart, Russell 2000 (small caps) and NASDAQ (tech dominated) are currently in bear market territory. Some of the other markets may soon follow, but I think most of the damage has already been done.
Chart 3. Market Sectors
Of the eleven primary market sectors, this chart shows the top three and bottom three performers. I do it this way to keep things simple.
Money has been flowing out of tech, consumer discretionary, and communications services, and into energy, utilities, and consumer staples. This trend will probably continue as long as there is uncertainty caused by the Russia-Ukraine war. Demand for oil & gas remains high, the global economy is taking a hit to growth. and inflation will continue to rise until energy prices begin to come down.
Chart 4. Industries
Of the 60 industry groups tracked by S&P Global Markets, I highlight the top and bottom three to keep this chart simple. Semiconductors, apparel, and autos are in bear markets and ripe with bargains for those who can tolerate a little more pain in the near-term.
Chart 5. Styles - Growth vs. Value
After underperforming growth last year, value is where the money is flowing. I see this as another durable trend. Growth has been hit hard by the slide in tech stocks this year. Small cap growth is where I would be looking to pick up quality names on the cheap.
Chart 6. Size
Small caps are still lagging. After underperforming last year, they are struggling to keep up this year. Mid caps were almost tied with large caps last year, and the are in the lead this year. The flow of money into mid caps looks like a durable trend.
Chart 7. Factors
There are more than 100 factors to choose from, so I had to cut the list to just six, in order to keep this chart reasonably easy to digest. High liquidity names are getting pummeled this year as asset managers sell their most liquid positions to meet shareholder redemptions.
The top performing factor so far is dividend yield. I'm not sure about the durability of this trend, because rising bond interest rates will begin to compete with dividends at some point.
Chart 8. Sensitivity to the business cycle
In this chart I divided the market sectors into two groups - those that respond more vigorously to the changing phases of the business cycle (cyclical), and those that respond less vigorously (defensive).
With the economy still in growth mode, cyclical stocks should do better than defensive stocks. That hasn't happened yet this year, and maybe the market is sending a signal that the economy isn't as strong as many would like to believe.
The flow of money away from cyclicals and into defensive looks durable.
Chart 9. Bonds
It's interesting to watch how the various flavors of bonds react to Quantitative Tightening. So far it looks like Treasury bonds are seeing the most outflows. That's understandable, given the sharp rise in the 2-yr and 10-yr rates.
Keep an eye on junk bonds, because they are especially vulnerable to an economic slowdown. As they continue to lose momentum, the risk of recession increases.
Chart 10. Countries
There are 50 countries that are represented by ETFs. Here are the top and bottom performers YTD. South America is having a resurgence this year, while Europe is struggling with geopolitical issues and heavy sanctions - both imposed and threatened.
Final Thoughts
We are now well into 2022 and the trends we have established thus far will probably continue as long as the war, and all the uncertainty it brings with it, remains in place. By keeping an eye on money flows among these asset categories, you can gain some insight into what could be a durable trend, and what's just noise.
The trends that look the most durable to me at this time are value vs. growth, mid cap vs. large and small cap, defensive vs. cyclical, and commodities - especially energy - vs. tech.
European and Asian economies seem more vulnerable to the fallout from sanctions against Russia. There is a chance that Europe may slip into a recession later this year, and some Asian countries may follow after that.
The US will likely avoid a recession this year, but the picture may change in 2023. The major Wall Street strategists have been reducing their price targets for year-end, with an average of 4600 for the S&P 500. That would represent a gain of 14% from where we are now, and a year-over-year loss of 3%.
As the late Marty Zweig used to say, don't fight the tape and don't fight the Fed. The tape is weak and the Fed appears to be gearing up to bring inflation under control regardless of what happens in the stock market. If the market ends the year with a small loss, it behooves investors to pick their spots carefully. That's why I like to follow the money.
Originally Posted on zeninvestor.org